

- kernel parameters /proc/cmdline (можно редактировать конфигом GRUB)
- kernel parameters modification /etc/sysctl.conf
- В Linux все рассматривается как файлы, включая устройства (/dev) и процессы (/proc)
- Любые изменения в /proc директории немедленно применяются kernel
All changes to files in /proc/ are immediately recognized by the kernel. The /proc/ directory is a virtual file system that provides information about processes and system resources. It allows processes to communicate with the kernel by reading from and writing to specific files in the /proc/ directory. Any changes made to these files are immediately recognized by the kernel, allowing for dynamic adjustments and monitoring of system parameters.
- Про перевод процессов в background в Linux подробнее в hotkeys (jobs, fg, bg, ctrl+z)
- Дерево процессов можно посмотреть через pstree, по умолчанию отображаются непользовательские процессы
~$ pstree
systemd─┬─NetworkManager───2*[{NetworkManager}]
  ├─agetty
  ├─auditd───{auditd}
  ├─crond
  ├─dbus-daemon
  ├─httpd───10*[httpd]
  ├─master─┬─pickup
  │ └─qmgr
  ├─mysqld_safe───mysqld───24*[{mysqld}]
  ├─polkitd───5*[{polkitd}]
  ├─rsyslogd───{rsyslogd} ├─sshd───sshd───sshd───bash───pstree
  ├─systemd-journal
  ├─systemd-logind
  ├─systemd-udevd
  └─wpa_supplicant
~$ pstree -pu
systemd(1)─┬─NetworkManager(464)─┬─{NetworkManager}(466)
  │ └─{NetworkManager}(469)
  ├─agetty(449)
  ├─auditd(412)───{auditd}(430)
  ├─crond(446)
  ├─dbus-daemon(435,dbus)
  ├─httpd(3474)─┬─httpd(12730,apache)
  │ ├─httpd(13772,apache)
  │ ├─httpd(13774,apache)
  │ ├─httpd(13775,apache)
  │ ├─httpd(13853,apache)
  │ ├─httpd(13857,apache)
  │ ├─httpd(13888,apache)
  │ ├─httpd(14286,apache)
  │ ├─httpd(14428,apache)
  │ └─httpd(15246,apache)  ├─master(2232)─┬─pickup(15221,postfix)
  │ └─qmgr(2270,postfix)
├─mysqld_safe(952,mysql)───mysqld(1858)─┬─{mysqld}(2200)
  │ ├─{mysqld}(2201)
  │ ├─{mysqld}(2202)
  │ ├─{mysqld}(2204)
  │ ├─{mysqld}(2587)
  │ ├─{mysqld}(2588)
  │ ├─{mysqld}(2589)
  │ ├─{mysqld}(2590)
  │ ├─{mysqld}(2591)
  │ ├─{mysqld}(2593)
  │ ├─{mysqld}(2684)
  │ ├─{mysqld}(2702)
  │ └─{mysqld}(2704)
  ├─polkitd(475,polkitd)─┬─{polkitd}(567)
  │ ├─{polkitd}(568)
  │ ├─{polkitd}(569)
  │ ├─{polkitd}(572)  ├─rsyslogd(433)───{rsyslogd}(462)
├─sshd(675)───sshd(13643)───sshd(13645,admin)───bash(13646)───pstree(15253)
  ├─systemd-journal(328)
  ├─systemd-logind(439)
  ├─systemd-udevd(349)  └─wpa_supplicant(474)
Процессы запускаются самой системой для функционирования системы, такие процессы называют background/daemon process. Разделение на application и background processes можно увидеть в Windows taskmanager.
Одна программа может инициировать множество процессов (chrome, mediaplayer). При запуске процесс получает Process ID (PID, уникальный идентификатор процесса). Так же каждый процесс запрашивает физические ресурсы у ядра системы – CPU, RAM, HDD/SDD (i/o), NIC. При завершении процесса (автоматически или вручную) ресурсы возвращаются обратно ядру. Особенно удобно потребление ресурсов просмотривать в Мониторинге ресурсов (Windows) или top (Linux).
Процессы в linux построены в древовидной структуре – каждый процесс имеет своего родителя, кроме init (см. ps -auxf или ps -ef) pid 1, который и является порождением других процессов. Справедливо и при использовании pipe – cat 1 | grep 2 – grep будет являться дочерним для cat.
A process is a program or command running on the system. Every process has a unique numeric identifier, known as the process identifier (PID), which is used by the kernel to manage and control the process through its lifecycle. The process with PID 0 is started first at system boot, followed by the process with PID 1, and so on. Processes are organized in a hierarchical fashion.

When a process completes its lifecycle or is terminated, this event is reported back to its parent process, and all the resources provisioned to it are then freed and the PID is removed.
В Linux дочерние процессы не могут работать независимо от родительских, в отличии от Windows (там дочерний процесс связан с родительским только в момент создания – заимствует environment:переменные/настройки). Видно это например при запуске из консоли приложения – если в Windows убить консоль, то с приложением ничего не будет, в отличии от Linux, который дропнет child процесс при отключении родительского (поэтому так полезны в Linux демоны/сервисы/screen).
Each process has a parent process (a.k.a. a calling process) that spawns it. Asingle parent process may have one or many child processes and passes many of its attributes to them at the time of their creation.
Процессам можно передавать сигналы Sig/Signals. Сигналы вообще основном способ взаимодействия между процессами/ядром и процессами, а не только между пользователем и процессом. С точки зрения пользователя Ctrl-c и в Windows и в Linux передает сигнал sigint (signal interrupt), который шлет прерывание процесса от системы процессу. В отличии от Linux, в Windows пользователю сложно отправить произвольный сигнал программе с командной строки (кроме прерывания ctrl-c). В Linux же таких сигналов очень много (смотрим через kill -l) и их можно отправить через kill, начинаются они по названию с приставки SIG (сокращенно от Signal, например sigint).
nice
У процессов есть приоритет исполнения на CPU – задачи с повышенном приоритетом исполняются первыми. В случае с Linux это называется niceness (nice value), значения в range от -20 до +19. Большая часть процессов по умолчанию запускается с значением 0 (в некоторых системах 10), дефолтное значение можно узнать командой nice без аргументов. Чем НИЖЕ значение nice у процесса, тем ВЫШЕ ее приоритет (принцип как в гольфе). Child процесс наследует nice значение у родительского. Посмотреть значение nice можно в top или по ps -efl.
nice – позволяет запускать приложения с заданным приоритетом nice value. Например, долгие неважные процессы (backup, обновление системы/приложений, скан сети) можно сделать с nice 15-20, а важные с -15 – -20. На практике чаще применяется для таких процессов как backup для того, чтобы они не влияли на основные процессы системы во время backup.
# запускаем команду с приоритетом -20 (все три команды об одном)
sudo nice -n -20 <command>
sudo nice --20 <command>
sudo nice --adjustment=-20 <command>

# пример использования nice для повышения приоритета процесса tcpdump
sudo nice --adjustment=-10 tcpdump -s 1514 -i eth2 -w /tmp/ramdisk/ecg_sniffer_eth2_20180321.pcap
renice нужен для изменения приоритета уже работающего процесса.
sudo renice -n 7 18153 - выставляем активному процессу 18153 приоритет 7
sudo renice -n -20 -u admin - делаем приоритет -20 для всех процессов пользователя admin
sudo renice -n 20 -g customers - делаем приоритет 20 для всех процессов группы customers

~$ sudo renice -n -18 29897
29897 (process ID) old priority 0, new priority -18
A process is spawned at a certain priority, which is established at initiation based on a numeric value called niceness (or a nice value). There are 40 niceness values, with –20 being the highest and +19 the lowest. Most system-started processes use the default niceness of 0. A higher niceness lowers the execution priority of a process and a lower niceness increases it. In other words, a process running at a higher priority gets more CPU scheduler attention. A child process inherits the niceness of its calling process in calculating its priority. Though we normally run programs at the default niceness, we may choose to initiate them at a different niceness to adjust their priority based on urgency and system load.

We can view current process priorities and niceness values with the ps command, the top command, and the system monitor GUI.
Просмотр процессов
ps (в Windows taskmanager ctrl-shift-esc, tasklist/get-process, process explorer) – process show – позволяет посмотреть процессы, запущенные в системе. По умолчанию, ps показывает только принадлежащие вам процессы (freebsd) или только принадлежащие текущему терминалу pts (Linux).
Альтернатива – просмотр папок для PID в /proc/<PID>. Оттуда ps (так же как и другие команды, например top), берет информацию о процессах. В этой папке можно найти всю-всю-всю информацию о конкретном процессе.
The data located under /proc is referenced by a number of system utilities, including top, ps, uname, and vmstat, for display purposes.
Популярные наборы опций:
~$ ps -ef
~$ ps -auxf
~$ ps -fU redkin_p
~$ ps -fG sudo
~$ ps -efl
Популярные опции:
-a - показывается все пользовательские процессы
-e - показывает все процессы, включая системные
-f/F/l - добавляются разные колонки к стандартному выводу. l добавляет pri/ni колонкие с значением niceness (приоритета процесса)
-U - фильтрация по пользователю
-G - фильтрация по группе
(файлы/процессы) lsof – показывает какие файлы используются какими процессами (включая библиотеки/логи и про). А т.к. в linux все есть файлы – это зачастую очень полезная утилита, полезна, например, для размонтирования флешек, поиска места, куда пишет лог процесс, какие библиотеки использует.
root@spr:~# lsof | grep squ
squid 526 root cwd DIR 8,1 4096 2 /
squid 526 root rtd DIR 8,1 4096 2 /
squid 526 root txt REG 8,1 7076024 144505 /usr/sbin/squid
squid 526 root mem REG 8,1 282752 139004 /usr/lib/x86_64-linux-gnu/libnss_systemd.so.2
squid 526 root mem REG 8,1 55792 131763 /usr/lib/x86_64-linux-gnu/libnss_files-2.28.so
squid 526 root mem REG 8,1 35224 132160 /usr/lib/x86_64-linux-gnu/libffi.so.6.0.4
squid 526 root mem REG 8,1 26616 136067 /usr/lib/x86_64-linux-gnu/libmnl.so.0.2.0
log_file_ 2307 proxy 3w REG 8,1 0 3671227 /var/log/squid/access.log
pinger 2308 proxy cwd DIR 8,1 4096 3672167 /var/spool/squid
pinger 2308 proxy txt REG 8,1 80536 144498 /usr/lib/squid/pinger
pinger 2308 proxy 2u REG 8,1 5928 3672498 /var/log/squid/cache.log
init – первый процесс стартуемый в системе linux. Имеет pid 1. Стартует другие процессы необходимые для работы системы.
~$ ps -aux | grep init
root 1 0.0 0.0 33700 1960 ? Ss янв.11 0:04 /sbin/init
Поля:
- USER – какой пользователь запустил процесс
- %CPU/%MEM – сколько CPU/MEM потребляет процесс
- PID – ID процесса
- PPID – ID родительского процесса (ps -ef)
- С – ID child процесса (ps -ef)
- TTY – терминал, связанный с процессом
- STAT – статус процесса, в один конкретным момент может быть только один статус
- R:Running – работает (исполняется CPU прямо сейчас),
- T:Stopped/Suspended – приостановлен (например через kill -20) и не будет исполнен, пока процесс не получит сигнал,
- S:Sleeping – interruptible sleep – ждет события (пользовательского ввода, другого процесса) для продолжения
- Waiting – sleeping процесс, который получил нужные данные для продолжения, но ждет очереди
- Z:Zombie (defunct) – мертвый процесс, который есть в таблице с процессами, но ресурсы памяти он не потребляет. Живет в системе чтобы родительский процесс смог читать его код возврата. Он не так опасен как процессы-сиротки (orphan process), но и не безобиден: Зомби не занимают памяти (как процессы-сироты), но блокируют записи в таблице процессов, размер которой ограничен для каждого пользователя и системы в целом. При достижении лимита записей все процессы пользователя, от имени которого выполняется создающий зомби родительский процесс, не будут способны создавать новые дочерние процессы. Кроме этого, пользователь, от имени которого выполняется родительский процесс, не сможет зайти на консоль (локальную или удалённую) или выполнить какие-либо команды на уже открытой консоли (потому что для этого командный интерпретатор sh должен создать новый процесс), и для восстановления работоспособности (завершения виновной программы) будет необходимо вмешательство системного администратора.
- orphan process – процесс сиротка, нештатно потерявший родительский процесс и переподчиненный/перешедший под покровительство процессу init/pid 1. Более опасны в сравнении с zombie т.к. потребляют ресурсы памяти и исполняются, а не просто хранят код возврата.
- В семействе операционных систем UNIX вспомогательный процесс, чей основной процесс (или связь с ним) был завершен нештатно (не подав сигнала на завершение работы).
- Процессы-сироты расходуют системные ресурсы сервера и могут быть источником проблем.
- В Unix-подобных системах все процессы-сироты немедленно усыновляются специальным системным процессом «init». Эта операция ещё называется переподчинением (англ. reparenting) и происходит автоматически. Хотя технически процесс «init» признаётся родителем этого процесса, его всё равно считают «осиротевшим», поскольку первоначально создавший его процесс более не существует.
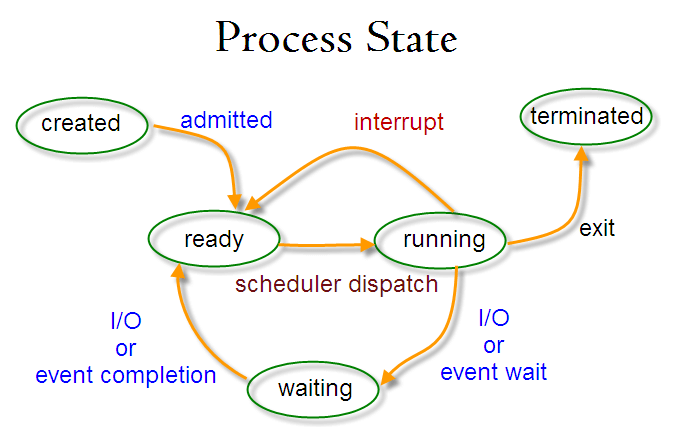
Each process is in one state at any given time. These states are running, sleeping, waiting, stopped, and zombie, and are explained below:
Running: the process is being executed by the system CPU.
Stopped: the process is currently halted and will not run even when its turn comes, unless a signal is sent to it to change its behavior.
Sleeping: the process is waiting for input from a user or another process.
Waiting: the process has received the input it was waiting for and is now ready to run as soon as its turn arrives.
Zombie: the process is dead. A zombie process exists in the process table alongside other process entries, but it takes up no resources!!!!. Its entry is retained until the parent process permits it to die. Azombie process is also called a defunct process
- STIME/START – когда запущен процесс
- TIME – время которое CPU обрабатывает процесс (совокупное)
TIME - Aggregated execution time for the process, including time spent in both userland and kernel space.
- COMMAND – исполняемая команда/процесс. При использовании флага -f совместно с -aux (-auxf) показывается дерево зависимостей процесса. Это может быть полезно для отслеживания приложения-источника, например zombie/defunct процессов (можно отследить и по ps -ef).
~$ ps -auxf
redkin_p 11293  0.0  0.0  27560  1928 ?        Ss   февр.02   0:00 SCREEN -S tp_daemon
redkin_p 11294  0.0  0.1  23664  2468 pts/2    Ss+  февр.02   0:00  \_ /bin/bash
redkin_p  6511  0.0  0.1  23692  2912 pts/4    Ss   марта11   0:00  \_ /bin/bash
redkin_p  4098  0.0  0.1 107076  2304 pts/4    S+   марта11   0:00      \_ python3 bin/tp_snmp_proxy.py
root      9507  0.0  0.2 392396  4880 ?        Ss   февр.19   1:10 /usr/sbin/apache2 -k graceful
www-data 19494  0.0  0.2 392964  4692 ?        S    марта10   0:00  \_ /usr/sbin/apache2 -k graceful
www-data 19495  0.0  0.2 393208  4668 ?        S    марта10   0:00  \_ /usr/sbin/apache2 -k graceful
www-data 19496  0.0  0.2 393208  4840 ?        S    марта10   0:00  \_ /usr/sbin/apache2 -k graceful
redkin_p 29897  1.5  3.9 1171484 81616 ?       Sl   03:00   9:54 ruby /home/redkin_p/bin/sms.rb
redkin_p 31681  0.0  0.0      0     0 ?        Z    10:49   0:00  \_ [sh] <defunct>
redkin_p   936  0.0  0.0      0     0 ?        Z    10:49   0:00  \_ [sh] <defunct>
redkin_p  9125  0.0  0.0      0     0 ?        Z    10:50   0:00  \_ [sh] <defunct>
redkin_p  9446  0.0  0.0      0     0 ?        Z    10:50   0:00  \_ [sh] <defunct>

~$ ps -ef | head
UID        PID  PPID  C STIME TTY          TIME CMD
root         1     0  0 янв.11 ?    00:00:04 /sbin/init
root         2     0  0 янв.11 ?    00:00:00 [kthreadd]
root         3     2  0 янв.11 ?    00:22:33 [ksoftirqd/0]
root         5     2  0 янв.11 ?    00:00:00 [kworker/0:0H]
root         7     2  0 янв.11 ?    01:04:51 [rcu_sched]

~$ ls -l /proc/ | head
total 0
dr-xr-xr-x  9 root          root                        0 янв.  30 00:30 1
dr-xr-xr-x  9 root          root                        0 янв.  30 00:30 10
dr-xr-xr-x  9 redkin_p      redkin_p                    0 марта 12 10:51 10700
dr-xr-xr-x  9 root          root                        0 янв.  30 00:30 1089
dr-xr-xr-x  9 root          root                        0 янв.  30 00:30 11
dr-xr-xr-x  9 root          root                        0 янв.  30 00:30 1114
dr-xr-xr-x  9 root          root                        0 янв.  30 00:30 1118
dr-xr-xr-x  9 root          root                        0 янв.  30 00:30 1124
dr-xr-xr-x  9 root          root                        0 янв.  30 00:30 1126


~$ ls -l /proc/10700/ | head
dr-xr-xr-x 2 redkin_p redkin_p 0 марта 12 14:07 attr
-rw-r--r-- 1 root     root     0 марта 12 14:07 autogroup
-r-------- 1 root     root     0 марта 12 14:07 auxv
-r--r--r-- 1 root     root     0 марта 12 14:07 cgroup
--w------- 1 root     root     0 марта 12 14:07 clear_refs
-r--r--r-- 1 root     root     0 марта 12 10:51 cmdline
-rw-r--r-- 1 root     root     0 марта 12 14:07 comm
-rw-r--r-- 1 root     root     0 марта 12 14:07 coredump_filter
-r--r--r-- 1 root     root     0 марта 12 14:07 cpuset

~$ cat /proc/10700/status
Name:   sh
State:  Z (zombie)
Tgid:   10700
Ngid:   0
Pid:    10700
PPid:   29897
TracerPid:      0
Uid:    1000    1000    1000    1000
Gid:    1000    1000    1000    1000
FDSize: 0
Groups: 4 24 27 30 46 110 111 1000 1003
NStgid: 10700
NSpid:  10700
NSpgid: 29896
NSsid:  29896
Threads:        1
SigQ:   0/7891
SigPnd: 0000000000000000
ShdPnd: 0000000000000000
SigBlk: 0000000000000000
SigIgn: 0000000000000000
SigCgt: 0000000000010002
CapInh: 0000000000000000
CapPrm: 0000000000000000
CapEff: 0000000000000000
CapBnd: 0000003fffffffff
CapAmb: 0000000000000000
Seccomp:        0
Speculation_Store_Bypass:       vulnerable
Cpus_allowed:   3
Cpus_allowed_list:      0-1
Mems_allowed:   00000000,00000001
Mems_allowed_list:      0
voluntary_ctxt_switches:        2
nonvoluntary_ctxt_switches:     1
# Показать PID процесса и дочерних процессов
# pidof показывает в одну строку
~$ pidof systemd
1
~$ pidof crond
441

# pgrep показывает в разные строки (+ поддерживает разные опции и regexp)
~$ pgrep systemd
1
327
337
427
~$ pgrep crond
441
~$ pgrep --oldest postgres # показать только родительский postgres
8434
Аналог ps из мира Windows Powershell – довольно удобно с pipe:sort, select на основе столбцов в выводе.
PS C:\WINDOWS\system32> Get-Process| Sort CPU -descending | Select -first 3 -property ID, ProcessName, CPU

Id ProcessName CPU
-- ----------- ---
8392 start 1231,53125
11484 chrome 749,71875
3912 avp 676,078125
Мониторинг всей системы
top/htop – мониторинг системных ресурсов и процессов в Linux. Показывает сводку по всей системе (сводка из команды uptime:uptime, user count, load average; tasks, CPU usage, Mem usage) и те процессы, которые потребляют больше всего ресурсов. Для начала в общем случае смотрится загрузка CPU/MEM, затем остальное.
В top можно наблюдать превышение утилизации выше 100% т.к. по умолчанию включен IRIX режим (IRIX ON), но на практике превышений утилизации выше 100% не наблюдал. В соответствии с документацией к TOP в многопроцессорной системе можно наблюдать утилизацию выше 100%.
      В утилите top режим Irix (названный в честь ОС IRIX от SGI) — это метод расчета загрузки процессора.
      В этом режиме процент нагрузки процесса на ЦП (%CPU) равен сумме использованного времени по всем ядрам.
      Для многоядерных систем это значение может превышать 100%.
         https://man7.org/linux/man-pages/man1/top.1.html

         In a true SMP environment, if a process is multi-threaded and
           top is not operating in Threads mode, amounts greater than
           100% may be reported.  You toggle Threads mode with the ‘H’
           interactive command.
           Also for multi-processor environments, if Irix mode is Off,
           top will operate in Solaris mode where a task's cpu usage will
           be divided by the total number of CPUs.  You toggle
           Irix/Solaris modes with the ‘I’ interactive command. ((shift + I))
load average (LA) – безразмерная метрика, показывает среднюю загрузку системы за период времени для всей системы (100% значения = ~60% загрузка за 1/5/15 минутный интервалы + ~40% загрузка со старта системы – подробнее ниже).
   load average aim7 multitask test
      top - 18:54:01 up 11 min,  3 users,  load average: 2516.06, 1286.62, 510.98
      Tasks: 2710 total,  33 running, 2677 sleeping,   0 stopped,   0 zombie
      %Cpu0  : 32.1 us, 67.9 sy,  0.0 ni,  0.0 id,  0.0 wa,  0.0 hi,  0.0 si,  0.0 st
      %Cpu1  : 23.2 us, 75.9 sy,  0.0 ni,  0.9 id,  0.0 wa,  0.0 hi,  0.0 si,  0.0 st
      %Cpu2  : 25.2 us, 74.8 sy,  0.0 ni,  0.0 id,  0.0 wa,  0.0 hi,  0.0 si,  0.0 st
      %Cpu3  : 25.2 us, 74.8 sy,  0.0 ni,  0.0 id,  0.0 wa,  0.0 hi,  0.0 si,  0.0 st
      MiB Mem :   3921.4 total,   1475.0 free,   1903.4 used,    772.7 buff/cache
      MiB Swap:      0.0 total,      0.0 free,      0.0 used.   2018.0 avail Mem
         PID USER      PR  NI    VIRT    RES    SHR S  %CPU  %MEM     TIME+ COMMAND
      16356 root      20   0   13304   8972   3756 R   8.9   0.2   0:03.88 top
         2135 root      20   0    4012   1868   1544 R   7.1   0.0   0:00.51 multitask
         3086 root      20   0    4012   1868   1544 R   6.2   0.0   0:00.23 multitask
         4129 root      20   0    4012   1868   1544 D   6.2   0.0   0:00.30 multitask
         1607 root      20   0    4012   1868   1544 R   5.4   0.0   0:00.57 multitask
-
- `Из практики могу сказать, что LA это индикатор средней загрузки всей системы и лучше смотреть загрузку по конкретным ядрам, потому что
- низкий LA это не показатель низкой загрузки конкретного ядра и в случае если приложение/worker однопоточное, оно может работать “в полке” (добавлять к общему LA единицу) и создавать проблемы (длительный отклик/потеря транзакций/проч), при этом общий LA за счет большого кол-ва CPU/cores будет низкий т.к. другие ядра простаивают.
- высокий LA нужно сопоставлять с количеством вычислительных ресурсов (CPU/Core), подробнее ниже.
-
На практике сталкивался с высоким load average на gentoo после нагрузки на cpu/HDD (сжатие/архивирование файлов, системное обновление), причем load average уже после самой причины загрузки “не уходил” в течении ~часа – видимо это шлейф 37%.
-
Чтобы получить понимание загружена ли система по load average, значение load average нужно поделить на количество CPU (ядер CPU). Конечно это далеко не всегда справедливо, потому что только в идеальных условиях, процессоры/ядра загружаются равномерно. Далее полученное значение сравнить с единицей. В результате Load average в значении 1.73 при разном количестве CPU/ядер говорит о разном:
-
- на системе c 8 CPU – система “отдыхает”
- на системе с 2 CPU – система недозагружена на 0.27%
- на системе с 1 CPU – система в полке на 0.73%
-
- `Из практики могу сказать, что LA это индикатор средней загрузки всей системы и лучше смотреть загрузку по конкретным ядрам, потому что
In UNIX computing, the system load is a measure of the amount of computational work that a computer system performs. The load average represents the average system load over a period of time. It conventionally appears in the form of three numbers which represent the system load during the last one-, five-, and fifteen-minute periods.

An idle computer has a load number of 0 (the idle process isn't counted). Each process using or waiting for CPU (the ready queue or run queue) increments the load number by 1. Each process that terminates decrements it by 1. Most UNIX systems count only processes in the running (on CPU) or runnable (waiting for CPU) states. However, Linux also includes processes in uninterruptible sleep states (usually waiting for disk activity), which can lead to markedly different results if many processes remain blocked in I/O due to a busy or stalled I/O system.[1] This, for example, includes processes blocking due to an NFS server failure or too slow media (e.g., USB 1.x storage devices). Such circumstances can result in an elevated load average which does not reflect an actual increase in CPU use (but still gives an idea of how long users have to wait).

~$ uptime
18:00:38 up 59 days, 18:18, 4 users, load average: 3,74, 4,29, 3,94

~$ cat /proc/loadavg
3.74 4.29 3.94 3/287 14030
В примере ниже с реальных серверов – сервер с 2 CPU очень нагружен (6.43/2), а сервера с 8 (3.65/8) и 16 (0.03/16) недозагружены.
~$ cat /proc/cpuinfo | grep processor | wc -l
2
~$ cat /proc/loadavg
6.43 5.56 5.04 3/379 347

$ cat /proc/cpuinfo | grep processor | wc -l
8
$ cat /proc/loadavg
3.65 4.73 4.96 3/248 30671

$ cat /proc/cpuinfo | grep processor | wc -l
16
$ cat /proc/loadavg
0.03 0.05 0.05 1/782 27791
For example, one can interpret a load average of "1.73 0.60 7.98" on a single-CPU system as:
- during the last minute, the system was overloaded by 73% on average (1.73 runnable processes, so that 0.73 processes had to wait for a turn for a single CPU system on average).
- during the last 5 minutes, the CPU was idling 40% of the time on average.
- during the last 15 minutes, the system was overloaded 698% on average (7.98 runnable processes, so that 6.98 processes had to wait for a turn for a single CPU system on average).
This means that this system (CPU, disk, memory, etc.) could have handled all of the work scheduled for the last minute if it were 1.73 times as fast.

In a system with four CPUs, a load average of 3.73 would indicate that there were, on average, 3.73 processes ready to run, and each one could be scheduled into a CPU.
Общий принцип работы LA – по умолчанию загрузка считается нулевой, каждый процесс, который ждет своей очереди для обработки CPU или Drive (HDD/SSD) добавляет значение в 1 к load average, каждый процесс, который прерывается, наоборот, уменьшает значение на 1. Сама метрика получается из файла /proc/loadavg. С точки зрения математики значение load average состоит из:
-
- 63% от значения берется из предыдущего минуты/5минут/15 минут
- 37% берется от загрузки с начала старта системы
Mathematically speaking, all three values always average all the system load since the system started up. They all decay exponentially, but they decay at different speeds: they decay exponentially by e after 1, 5, and 15 minutes respectively. Hence, the 1-minute load average consists of 63% (more precisely: 1 - 1/e) of the load from the last minute and 37% (1/e) of the average load since start up, excluding the last minute. For the 5- and 15-minute load averages, the same 63%/37% ratio is computed over 5 minutes and 15 minutes respectively. Therefore, it is not technically accurate that the 1-minute load average only includes the last 60 seconds of activity, as it includes 37% of the activity from the past, but it is correct to state that it includes mostly the last minute.
lsof – показать открытые процессами файлами. Сопоставление какой файл открыт каким процессом. Может быть полезно при размонтировке носителей (напр. ошибка “device or resource busy” при попытке eject USB). Чтобы посмотреть все процессы нужно запускать из под sudo.
~$ sudo lsof | wc
6175 58986 749350
~$ lsof | wc
2163 20393 250710
Изменение процессов
kill (в Windows taskmanager ctrl-shift-esc, taskkill, process explorer can restart/pause processes) – позволяет остановить (частный случай для Linux kill) процесс/процессы по ID процесса (PID), процессы определенного пользователя и проч.
kill -9 # принудительная остановка процесса (SIGKILL)
kill -9 -1 # принудительная остановка всех процессов пользователя (SIGKILL)
kill -9 $(pgrep -f 'top') # принудительная остановка всех процессов top
kill -1 # сигнализируем процессу, что ему нужно перечитать свою конфигурацию (может быть проигнорировано приложением) (SIGHUP)
kill -2 или ctrl-c # сигнализируем процессу, что ему нужно прерывать исполнение (SIGINT)
kill -15 # софт-остановка процесса (может быть проигнорирована приложением) (SIGTERM)
kill -20 или ctrl-z # приостановить процесс (suspended state, SIGTSTP)
kill -18 или ctrl-z # возобновить процесс (SIGCONT)
kill позволяет отсылать большое количество сигналов процессам. По умолчанию используется непринудительная остановка процесса kill -15 (SIGTERM), которая позволяет приложению высвободить ресурсы и приостановить отключение, в случае если оно считает что отключение прямо сейчас опасно (например, для завершения подпроцессов/сохранения файлов в постоянную память/корректного высвобождения памяти или просто прописан exception не умирать никогда). Поэтому рекомендуется использование именно его для завершения процессов и именно он используется по умолчанию, а не kill -9 (SIGKIL), который может привести к разным проблемам – осиротевшим процессам/zombie/проблемам в application логике (напр. не до конца выполненные операции). kill -l позволяет показать все возможные сигналы, которые можно отослать процессу (64 штуки!).
Наиболее часто используемые:
1 SIGHUP (reload) Hang up signal causes a process to disconnect itself from a closed terminal that it was tied to. Also used to instruct a running daemon to re-read its configuration.
2 SIGINT The ^c signal issued on the controlling terminal to interrupt the execution of a process.
9 SIGKILL (kill abruptly) Kills a process abruptly. Some processes ignore signal 15 as they might be waiting for an input to continue processing. Such processes may be terminated forcefully using signal 9.
15 SIGTERM (stop execution by process) Sends a soft termination signal to stop a process in an orderly fashion. This signal may be ignored by a process. This is the default signal.

~$ kill -l
 1) SIGHUP 2) SIGINT 3) SIGQUIT 4) SIGILL 5) SIGTRAP
 6) SIGABRT 7) SIGBUS 8) SIGFPE 9) SIGKILL 10) SIGUSR1
11) SIGSEGV 12) SIGUSR2 13) SIGPIPE 14) SIGALRM 15) SIGTERM
16) SIGSTKFLT 17) SIGCHLD 18) SIGCONT 19) SIGSTOP 20) SIGTSTP
21) SIGTTIN 22) SIGTTOU 23) SIGURG 24) SIGXCPU 25) SIGXFSZ
26) SIGVTALRM 27) SIGPROF 28) SIGWINCH 29) SIGIO 30) SIGPWR
31) SIGSYS 34) SIGRTMIN 35) SIGRTMIN+1 36) SIGRTMIN+2 37) SIGRTMIN+3
38) SIGRTMIN+4 39) SIGRTMIN+5 40) SIGRTMIN+6 41) SIGRTMIN+7 42) SIGRTMIN+8
43) SIGRTMIN+9 44) SIGRTMIN+10 45) SIGRTMIN+11 46) SIGRTMIN+12 47) SIGRTMIN+13
48) SIGRTMIN+14 49) SIGRTMIN+15 50) SIGRTMAX-14 51) SIGRTMAX-13 52) SIGRTMAX-12
53) SIGRTMAX-11 54) SIGRTMAX-10 55) SIGRTMAX-9 56) SIGRTMAX-8 57) SIGRTMAX-7
58) SIGRTMAX-6 59) SIGRTMAX-5 60) SIGRTMAX-4 61) SIGRTMAX-3 62) SIGRTMAX-2
63) SIGRTMAX-1 64) SIGRTMAX
# Дочерние
pkill <name> - оперирует названием процесса (по сути kill`pidof <process_name`)
pkill t-rex-64 - убиваем процесс t-rex-64
# apt-get install psmisc # для работы killall
killall <name> - убить все процессы (если больше одного)
killall -9 python - убиваем принудительно все процессы python
классика жанра (ничего нового) – affinity, isolated, polling

Core (logical/physical) numbers
Количество процессинг-юнитов (физических CPU). Может не совпадать с top (добавляются логические CPU, как в примерах ниже).
$ nproc
4
 nproc - print the number of processing units available.
Понятнее всего количество физических и логических ядер посмотреть в выводе lscpu
-
- логические (общее количество на систему) в виде CPU(s). Отображаются все CPU, включая созданные hyperthreading – в данном выводе 2 процессора E5-2620 v3 с 6 физическими ядрами на борту и 12 потокама (12 * 2 = 24). Так же ниже пример с 112 CPU на базе сервера с двумя Xeon Gold 5420.
- физические (количество на сокет) в виде Core(s) per socket
# E5-2620 v3
lscpu
Architecture: x86_64
CPU op-mode(s): 32-bit, 64-bit
Byte Order: Little Endian
CPU(s): 24
On-line CPU(s) list: 0-23
Thread(s) per core: 2
Core(s) per socket: 6
Socket(s): 2
NUMA node(s): 2
Vendor ID: GenuineIntel
CPU family: 6
Model: 63
Model name: Intel(R) Xeon(R) CPU E5-2620 v3 @ 2.40GHz

top
%Cpu0 : 0.0 us, 0.0 sy, 0.0 ni,100.0 id, 0.0 wa, 0.0 hi, 0.0 si, 0.0 st
%Cpu1 : 2.1 us, 2.1 sy, 0.0 ni, 95.7 id, 0.0 wa, 0.0 hi, 0.0 si, 0.0 st
%Cpu2 : 0.0 us, 0.0 sy, 0.0 ni,100.0 id, 0.0 wa, 0.0 hi, 0.0 si, 0.0 st
%Cpu3 : 0.0 us, 0.0 sy, 0.0 ni,100.0 id, 0.0 wa, 0.0 hi, 0.0 si, 0.0 st
%Cpu4 : 0.0 us, 0.0 sy, 0.0 ni,100.0 id, 0.0 wa, 0.0 hi, 0.0 si, 0.0 st
%Cpu5 : 0.0 us, 0.0 sy, 0.0 ni,100.0 id, 0.0 wa, 0.0 hi, 0.0 si, 0.0 st
%Cpu6 : 0.0 us, 0.0 sy, 0.0 ni,100.0 id, 0.0 wa, 0.0 hi, 0.0 si, 0.0 st
%Cpu7 : 0.0 us, 0.0 sy, 0.0 ni,100.0 id, 0.0 wa, 0.0 hi, 0.0 si, 0.0 st
%Cpu8 : 0.0 us, 0.0 sy, 0.0 ni,100.0 id, 0.0 wa, 0.0 hi, 0.0 si, 0.0 st
%Cpu9 : 0.0 us, 0.0 sy, 0.0 ni,100.0 id, 0.0 wa, 0.0 hi, 0.0 si, 0.0 st
%Cpu10 : 0.0 us, 0.0 sy, 0.0 ni,100.0 id, 0.0 wa, 0.0 hi, 0.0 si, 0.0 st
%Cpu11 : 0.0 us, 0.0 sy, 0.0 ni,100.0 id, 0.0 wa, 0.0 hi, 0.0 si, 0.0 st
%Cpu12 : 0.0 us, 0.0 sy, 0.0 ni,100.0 id, 0.0 wa, 0.0 hi, 0.0 si, 0.0 st
%Cpu13 : 0.0 us, 0.0 sy, 0.0 ni,100.0 id, 0.0 wa, 0.0 hi, 0.0 si, 0.0 st
%Cpu14 : 0.0 us, 0.0 sy, 0.0 ni,100.0 id, 0.0 wa, 0.0 hi, 0.0 si, 0.0 st
%Cpu15 : 0.0 us, 0.0 sy, 0.0 ni,100.0 id, 0.0 wa, 0.0 hi, 0.0 si, 0.0 st
%Cpu16 : 0.0 us, 0.0 sy, 0.0 ni,100.0 id, 0.0 wa, 0.0 hi, 0.0 si, 0.0 st
%Cpu17 : 0.0 us, 0.0 sy, 0.0 ni,100.0 id, 0.0 wa, 0.0 hi, 0.0 si, 0.0 st
%Cpu18 : 0.0 us, 0.0 sy, 0.0 ni,100.0 id, 0.0 wa, 0.0 hi, 0.0 si, 0.0 st
%Cpu19 : 0.0 us, 0.0 sy, 0.0 ni,100.0 id, 0.0 wa, 0.0 hi, 0.0 si, 0.0 st
%Cpu20 : 0.0 us, 0.0 sy, 0.0 ni,100.0 id, 0.0 wa, 0.0 hi, 0.0 si, 0.0 st
%Cpu21 : 0.0 us, 0.0 sy, 0.0 ni,100.0 id, 0.0 wa, 0.0 hi, 0.0 si, 0.0 st
%Cpu22 : 0.0 us, 0.0 sy, 0.0 ni,100.0 id, 0.0 wa, 0.0 hi, 0.0 si, 0.0 st
%Cpu23 : 0.0 us, 0.0 sy, 0.0 ni,100.0 id, 0.0 wa, 0.0 hi, 0.0 si, 0.0 st
# i3-4360
lscpu
Architecture: x86_64
CPU op-mode(s): 32-bit, 64-bit
Byte Order: Little Endian
CPU(s): 4
On-line CPU(s) list: 0-3
Thread(s) per core: 2
Core(s) per socket: 2
Socket(s): 1
NUMA node(s): 1
Vendor ID: GenuineIntel
CPU family: 6
Model: 60
Model name: Intel(R) Core(TM) i3-4360 CPU @ 3.70GHz

top
%Cpu0 : 0.4 us, 0.0 sy, 0.0 ni, 99.6 id, 0.0 wa, 0.0 hi, 0.0 si, 0.0 st
%Cpu1 : 0.4 us, 0.4 sy, 0.0 ni, 99.1 id, 0.0 wa, 0.0 hi, 0.0 si, 0.0 st
%Cpu2 : 0.0 us, 0.0 sy, 0.0 ni,100.0 id, 0.0 wa, 0.0 hi, 0.0 si, 0.0 st
%Cpu3 : 0.0 us, 0.0 sy, 0.0 ni,100.0 id, 0.0 wa, 0.0 hi, 0.0 si, 0.0 st
# Intel Xeon Gold 5420
$ lscpu
Architecture:                   x86_64
CPU op-mode(s):                 32-bit, 64-bit
Address sizes:                   46 bits physical, 57 bits virtual
Byte Order:                     Little Endian
CPU(s):                         112
On-line CPU(s) list:             0-111
Vendor ID:                       GenuineIntel
BIOS Vendor ID:                 Intel(R) Corporation
Model name:                     Intel(R) Xeon(R) Gold 5420+
BIOS Model name:                 Intel(R) Xeon(R) Gold 5420+
CPU family:                     6
Model:                           143
Thread(s) per core:             2
Core(s) per socket:             28
Socket(s):                       2
Stepping:                       8
CPU(s) scaling MHz:             99%
CPU max MHz:                     4100.0000
CPU min MHz:                     800.0000
BogoMIPS:                       4000.00
Flags:                           fpu vme de pse tsc msr pae mce cx8 apic sep mtrr pge mca cmov pat pse36 clflush dts acpi mmx fxsr sse sse2 ss ht tm pbe syscall nx pdpe1gb rdtscp lm constant_tsc art arch_perfmon pebs bts rep_good nopl xtopology nonstop_tsc cpuid aperfmperf tsc_known_freq pni pclmulqdq dtes64 monitor ds_cpl vmx smx est tm2 ssse3 sdbg fma cx16 xtpr pdcm pcid dca sse4_1 sse4_2 x2apic movbe popcnt tsc_deadline_timer aes xsave avx f16c rdrand lahf_lm abm 3dnowprefetch cpuid_fault epb cat_l3 cat_l2 cdp_l3 intel_ppin cdp_l2 ssbd mba ibrs ibpb stibp ibrs_enhanced tpr_shadow flexpriority ept vpid ept_ad fsgsbase tsc_adjust bmi1 avx2 smep bmi2 erms invpcid cqm rdt_a avx512f avx512dq rdseed adx smap avx512ifma clflushopt clwb intel_pt avx512cd sha_ni avx512bw avx512vl xsaveopt xsavec xgetbv1 xsaves cqm_llc cqm_occup_llc cqm_mbm_total cqm_mbm_local split_lock_detect avx_vnni avx512_bf16 wbnoinvd dtherm ida arat pln pts hwp hwp_act_window hwp_epp hwp_pkg_req vnmi avx512vbmi umip pku ospke waitpkg avx512_vbmi2 gfni vaes vpclmulqdq avx512_vnni avx512_bitalg tme avx512_vpopcntdq la57 rdpid bus_lock_detect cldemote movdiri movdir64b enqcmd fsrm md_clear serialize tsxldtrk pconfig arch_lbr ibt amx_bf16 avx512_fp16 amx_tile amx_int8 flush_l1d arch_capabilities
Virtualization:                 VT-x
L1d cache:                       2.6 MiB (56 instances)
L1i cache:                       1.8 MiB (56 instances)
L2 cache:                       112 MiB (56 instances)
L3 cache:                       105 MiB (2 instances)
NUMA node(s):                   2
NUMA node0 CPU(s):               0-27,56-83
NUMA node1 CPU(s):               28-55,84-111
Vulnerability Gather data sampling: Not affected
Vulnerability Itlb multihit:     Not affected
Vulnerability L1tf:             Not affected
Vulnerability Mds:               Not affected
Vulnerability Meltdown:         Not affected
Vulnerability Mmio stale data:   Not affected
Vulnerability Retbleed:         Not affected
Vulnerability Spec rstack overflow: Not affected
Vulnerability Spec store bypass: Mitigation; Speculative Store Bypass disabled via prctl
Vulnerability Spectre v1:       Mitigation; usercopy/swapgs barriers and __user pointer sanitization
Vulnerability Spectre v2:       Mitigation; Enhanced / Automatic IBRS, IBPB conditional, RSB filling, PBRSB-eIBRS SW sequence
Vulnerability Srbds:             Not affected
Vulnerability Tsx async abort:   Not affected
isolcpus
- Isolcpus deprecated функционал. У isolcpus есть два существенных недостатка, которых нет у ниже описанного cpuset shield (cset shield):
- для ядер CPU, которые находятся в изоляции не работает scheduler операционной системы и нагрузка одного приложения не будет распределяться по нескольким CPU, даже если так настроен taskset
- isolcpus можно настроить только с перезагрузкой (изменение grub)
Since isolated CPUs are excluded from SMP balancing and the scheduler algorithm, it's not desirable to use them in situations where you want a process balanced across multiple CPUs. In such cases, shielding is more desirable (see the man page for cset-shield):
- Normally, when I have isolcpus, starting a process with taskset -c 2-32 means all threads end up on core 2 as isolcpus "removes cores from scheduler" as I was told so there is no load balancing.
-  Similar to taskset, it's possible to define more than one CPU in a cpuset, however, due to the nature of isolated CPUs, only the first defined CPU will be effective.
- Cgroup cpuset is not balancing tasks on CPUs isolated via isolcpus kernel parameter Automated load balancing of a process/task across multiple isolated CPUs is not possible.
Изоляция CPU позволяет “вынести” CPU из общих ресурсов и в последующем прибиндить его к конкретной app, которая потенциально будет работать более стабильно/производительно в такой конфигурации за счет отсутствия переключения контекста и кеша. По факту, пишут, что преимущества изоляции сейчас минимальны и многие приложения прекрасно масштабируются/балансируются на CPU без присвоения им конкретных ядер обработки (запуск нескольких instance приложения без присвоения каждому конкретных ядер).
Since isolated CPUs are excluded from SMP balancing and the scheduler algorithm, it's not desirable to use them in situations where you want a process balanced across multiple CPUs. In such cases, shielding is more desirable (see the man page for cset-shield).

The isolcpus option can be used to isolate cores from the Linux scheduler. The isolated cores can then be used to dedicatedly run HPC applications or threads. This helps in better application performance due to zero context switching and minimal cache thrashing. It has been verified that core isolation has minimal advantage due to mature Linux scheduler in some circumstances.
Пример настройки – 1) выводим из системы 7 ядер из 8 или 2) с 1 по 19. Нулевое ядро в обоих случаях оставляем системе в GRUB cmdline.
vim.tiny /etc/default/grub
   GRUB_CMDLINE_LINUX="isolcpus=1,2,3,4,5,6,7"
   GRUB_CMDLINE_LINUX="isolcpus=1-19"
sudo update-grub
You can also use taskset pointed to PID 1. As PID 1 is the standard PID for the first task launched by the kernel, we can take as a pretty good indication that it will reflect whether we have isolcpus working. As in:

$taskset -cp 1
pid 1's current affinity list: 0,1

$lscpu | grep CPU.s
CPU(s): 4
On-line CPU(s) list: 0-3
NUMA node0 CPU(s): 0-3

As it can be seen, lscpu is showing 4 CPU/cores, while taskset is only showing 0,1, so this shows isolcpus is working here.
Так же можно посмотреть с каким CMDLINE была загружена система.
# cat /proc/cmdline
BOOT_IMAGE=/boot/vmlinuz-3.2.0-4-amd64 root=UUID=fcd249ff-8e89-408d-bc51-e8868dc14748 ro isolcpus=1 quiet

Когда указана опция quiet, ядро не будет выводить никаких информационных сообщений о загрузке. Если ядро будет загружаться без этой опции, то Вы увидите набор некоторых сообщений, показывающих процессы активации драйверов и модулей системы, проверки файловой системы. Удаление параметра quiet может быть полезным, когда Вы хотите обнаружить ошибку, проявляющуюся при загрузке.
cpuset shield (cset shield)
- (CPUSET/CSET SHIELD, ISOLCPUS, AFFINITY, IxChariot) Конфигурация системы (нагрузчик IxChariot Endpoint) которую я настраивал для создания высокой нагрузки (более 10 gbps TCP трафиком), всего 4 ядра CPU в системе:
- использовал cpuset с shield (cset shield) для ядер CPU 2-3, на которых запускается endpoint процесс с балансировкой нагрузки между ядрами
- использовал isolated CPU для ядра 1 (isolcpus), прерывания очередей нагрузочных интерфейсов (сетевой карты 10G) переведены на отдельное изолированное ядро 1 (smp_affinity) – периодически были всплески на CPU1 до 80%, но редко (для отлова чаще всего нужно использовать top с настройками обновления чаще 1 раз в 3с) в отличии от конфигураций shield 1-3 или default конфигурации
- системные процессы работали на оставшемся ядре 0 – конфиги ниже однозначно проявили себя хуже
- если все держать в общем пуле (linux + endpoint + прерывания) – система (SSH) не тормозит, но производительность упирается в прерывания на нулевом ядре
- если на CPU 0 обрабатывать как прерывания (только на нем), так и системные задачи (linux + прерывания) – система явно упирается в прерывания на нулевом ядре и даже SSH начинает тормозить, результаты ухудшаются
- если выделять два ядра CPU0 + CPU1 под общие задачи прерывания и системные задачи (linux + прерывания), а приложение держать на отдельных двух – все ок и с системой и с результатами тестирования производительности приложения, но потенциально вариант с разделением прерываний на отдельный CPU более стабилен и я остановился на нем
Включает в себя достоинства isolcpus и при этом в этом функционале отсутствуют недостатки isolcpus – одно приложение в группе cset shield балансируется между выделенными в shield ядрами, настройка cset shield возможна без перезагрузок системы.
# INSTALL CPUSET/CSET
apt-get install cpuset

# CHECK THAT SHIELD OFF
taskset -cp 1
  pid 1's current affinity list: 0-3

# CREATE SHIELD
cset shield --cpu 2-3 --kthread on

# RUN APP IN SHIELD
cset shield --exec /usr/local/some_application
# ALTERNATE
set shield --shield --pid 3237

# DELETE APP FROM SHIELD
cset shield --unshield --pid 3237

# CHECK
taskset -cp 1  # check system pid
  pid 1's current affinity list: 0-1
taskset -cp 19  # check app pid
  pid 19's current affinity list: 2-3
cset shield -s  # show shield load
  cset: "user" cpuset of CPUSPEC(2-3) with 13 tasks running
  cset: done
Если нужно, чтобы cset настраивался сразу при запуске системы – это легко сделать добавив те же команды настройки cset в автостарт системы (напр. /etc/rc.local или systemctl). Единственная особенность – запуск приложения в shield и cset нужно разносить каким-то ожиданием или sleep (на практике достаточно 5 секунд) или проверкой создания, иначе приложение не запустится т.к. cset shield еще не будет создан.
maxcpus
Изменять количество активных CPU в сторону понижения надежнее всего через maxcpus.
I have got some interesting experience with
> switching on/off the CPU cores. First, I did the on/off switching of
> the i-th CPU core by writing 1/0 values into the
> /sys/devices/system/cpu/cpu$i/onlinefile of the working Linux kernel
> [2]. Whereas it seemed to work well, when the query rates were
> moderate (a few times ten thousand queries per second), it caused
> problems in the second case, when I used up to 3 million queries per
> second query rates, and thus I rather set the number of active CPU
> cores at the DUT by using the maxcpus=nkernel parameter.
performance and mitigations OFF
Mitigations — параметр загрузки ядра Linux, который позволяет включать или отключать средства защиты от аппаратных уязвимостей центрального процессора (Transient Execution Vulnerabilities). Эти меры направлены на предотвращение эксплуатации уязвимостей, например, Spectre, Meltdown, MDS.
В 2020 году можно было получить около 20% перформанса от процессора бесплатно, просто вписав на одну строчку и выключив патчи безопасности. Однако эксперименты команды показали, что чем новее процессор, тем меньше шанс, что отключение патчей безопасности поможет.
GRUB_CMDLINE_LINUX='mitigations=off'
https://linuxreviews.org/HOWTO_make_Linux_run_blazing_fast_(again)_on_Intel_CPUs
I stopped using that because I don't see any difference. i5-5200U
performance and Scaling governor performance
A Linux scaling governor is an algorithm within the CPUFreq subsystem that determines how the CPU's clock speed scales up or down based on system load, with different governors prioritizing performance, power saving, or a balance between them. Common governors include performance, which keeps the CPU at its highest speed, and powersave, which forces the CPU to the lowest speed for maximum energy conservation. You can view and change the active governor using commands in the terminal via the /sys filesystem.

Common governors and their effects
-performance: Keeps the CPU at its maximum frequency, increasing performance at the cost of higher power consumption and heat.
-powersave: Sets the CPU to its lowest possible static frequency, saving energy and extending battery life but significantly reducing performance.
-ondemand: Increases the CPU frequency to a higher level when load is high and decreases it when load is low, balancing performance and power saving.
interrupts, SMP IRQ affinitY
- (CPU, ipsec) Системные настройки для ускорения работы сетевых приложений на примере небольшого исследования RedHat с performance тестами IPSec
- Process pinning to CPU
- interrupts pinning to cores on one numa node (disabling irq balance)
- If the pinning is not configured correctly, the results are not stable, and if the interrupts get spread across the second NUMA node to which the NIC is not connected, throughput performance will be hit up to 35%. (tuna isolate –socket 0)
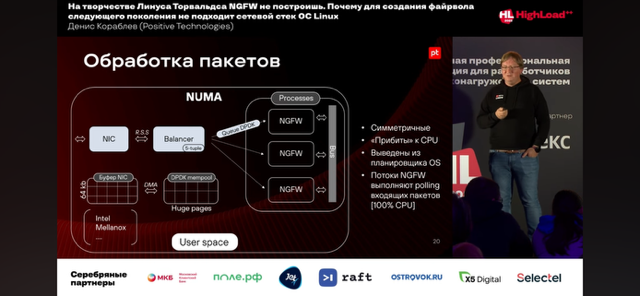
- (NIC, CPU) Чаще всего для усредненных сетевых application ядро CPU биндится к очереди сетевой карты как на отправку, так и на выгребание приема (прерывания/polling), на это же ядро вешается userspace приложение которое непосредственно реализует обработку пакетов или приложение крутится на отдельном (я делал при ускорении IxChariot отдельные ядра для прерываний и работы application). Пример стороннего описания:
Типовой конфиг сетевого девайса - к каждой очереди привязано ядро, выгребающее пакеты и отправляющее пакеты (номера могут не совпадать). После этого обработкой пакетов могут заниматься или те же ядра или отдельный (RPS/RSS).

Потому очереди и привязаны к ядрам, что с одной очередью два ядра работать не могут (как правило; в DPDK, кажется, есть capability для mutlithread-safe очередей, но примеры поддержки мне неизвестны). Это я назвал "очередь однопоточная". Если Rx-очередей две, то и выгребать пакеты из них будут два ядра. Когда нет RPS, пакеты так и будут обработаны этими двумя ядрами. В одну Tx-очередь тоже должно класть пакеты только одно ядро. Со стороны системы проще и эффективнее всего, чтобы конкретное ядро клало пакеты всегда в одну Tx-очередь интерфейса. Итого выходит, что за ядром 1 закреплена Rx-очередь 0 на одном интерфейсе и Tx-очередь 6 на другом (номера очередей от балды для примера). Поэтому и наблюдаем, что задействованы только две Tx-очереди, потому что задействованы всего два ядра, потому что Rx-очереди две. Если бы RPS раскидало пакеты на больше ядер, им бы соответствовало больше Tx-очередей. В обратную сторону, с большего числа очередей и ядер на меньшее число очередей, ядро, видимо, делает какие-то приседания.
- Почему прерывания важны и как их настраивать хорошо описано в статье alibaba cloud и статье Oracle; ниже лишь интересные выдержки
- When the bits for four CPUs are set to f, all CPUs are used to handle interrupts.
CPU ID Binary Hexadecimal
CPU 0 0001 1
CPU 1 0010 2
CPU 2 0100 4
CPU 3 1000 8
-
- прерывания – это триггер, сгенерированный девайсом (сетевой картой, дисковым контроллером), получив этот триггер CPU должен его обработать (в том числе остановив текущую задачу)
When a hardware component (such as a disk controller or an Ethernet NIC) needs to interrupt the work of the CPU, it triggers an interrupt. The interrupt notifies the CPU that an event occurred and the CPU should suspend its current work to deal with the event.
-
- во многих случаях несмотря на низкую совокупную утилизацию CPU производительность низка из-за высокой загрузки ядра (или ядер) CPU, обрабатывающего прерывания – к примеру без SMP IRQ affinity все прерывания всех сетевых карт распределены на нулевое ядро CPU0, что, очевидно, может быть bottleneck
In many cases, when overall CPU usage is low but performance is poor, it is usually the CPU core specified to handle interrupts is fully occupied. Let's take NIC interrupts as an example. Without the SMP IRQ affinity, all NIC interrupts are associated with CPU 0. As a result, CPU 0 is overloaded and cannot efficiently process network packets, causing a bottleneck in performance.
-
- распределение прерываний на специальные CPU/группы CPU (лучше группы) в виде SMP IRQ affinity появилось еще в Linux ядре 2.4, к примеру можно переводить полностью NIC на определенные ядра или более стандартно – переводить определенные очереди каждой NIC на отдельные ядра (используя RSS или Soft RSS RPS/RFS). Нежелательно использовать CPU0 для прерываний RPS.
Balancing network interrupts among multiple CPUs increases the performance of network-based operations.

In kernel 2.4 and later, Linux improves the capability of assigning specific interrupts to the specified processors (or processor groups). This is called the SMP IRQ affinity, which controls how the system responds to various hardware events. You can limit or redistribute the server workload so that the server can work more efficiently. After you configure the SMP IRQ affinity, multiple NIC interrupts are allocated to multiple CPUs to distribute the CPU workload and speed up data processing. The SMP IRQ affinity requires NICs to support multiple queues. A NIC supporting multiple queues has multiple interrupt numbers, which can be evenly allocated to different CPUs. In the following example, interrupt 27 is allocated to CPU 0 for processing. Generally, you are recommended to leave CPU 0 unused.
-
- ((с другой стороны в Linux по умолчанию работает NAPI)) по идее задачу динамически должен и решает IRQbalance, но по факту
- он часто выключен по умолчанию
- зачастую даже при включении все равно более правильным решением является настройкам вручную прерываний и отключение IRQbalance (лаг на адаптацию при спайках нагрузки, высокий уровень context switch, глюки)
- возможным (не тестил) промежуточным вариантом является вынесение части ядер из irq balance: IRQBALANCE_BANNED_CPULIST=5-12
- ((с другой стороны в Linux по умолчанию работает NAPI)) по идее задачу динамически должен и решает IRQbalance, но по факту
Most Linux installations are not configured to balance network interrupts. The default network interrupt behavior uses a single processor (typically CPU0) to handle all network interrupts and can become a serious performance bottleneck with high volumes of network traffic. Balancing network interrupts among multiple CPUs increases the performance of network-based operations.

IRQbalance is applicable to most scenarios. However, in scenarios requiring high network performance, you are recommended to bind interrupts manually. IRQbalance can cause some issues during operation:
(a) The calculated value is sometimes inappropriate, failing to achieve load balancing among CPUs.
(b) When the system is idle and IRQs are in power-save mode, IRQbalance distributes all interrupts to the first CPU, to make other idle CPUs sleep and reduce energy consumption. When the load suddenly rises, performance may be degraded due to the lag in adjustment.
(c) The CPU specified to handle interrupts frequently changes, resulting in more context switches.
(d) IRQbalance is enabled but does not take effect, that is, does not specify a CPU for handling interrupts.
- IRQbalance помогает в средних сценариях, но по факту:
- Он иногда не работает (у меня так же было) и это приводит к деградации производительности/росту задержек и потерь
- С высокой прозводительностью зачастую лучше настроить прерывания вручную – IRQbalance is applicable to most scenarios. However, in scenarios requiring high network performance, you are recommended to bind interrupts manually.
Настройка affinity позволяет:
-
- привязать процесс к конкретному ядру (конкретным) CPU
- привязать очередь прерываний к конкретному ядру, например, очередь прерываний с сетевой карты биндится к конкретному ядру процессора (напр. так реализовано в TRex)
Часто используется в задачах генерации/обработки большой нагрузки. Привязка приводит к повышению стабильности производительности и росту данной производительности (пример описан в ESXi). Affinity работает зачастую в связке c распределением потоков на базе расчета hash для передаваемых потоков:
-
- на базе сетевой карты RSS, подробнее о очередях RSS сетевых карт в статье про сетевые карты
- на базе софтверного расчета hash/распределения (напр. когда. RSS на сетевой не поддерживается или не реализует необходимое распределение (5-tuple))
Технология RSS позволяет аппаратно раскидывать приходящие на сетевую карту пакеты на несколько процессоров, где они обрабатываются различными потоками. При этом выполнять все операции с пакетом непосредственно на том процессоре, куда пакет аппаратно попал, нецелесообразно, обычно делают так: несколько процессорных ядер выделяется под RSS, где потоки выгребают пакеты из сетевой карты и раскидывают по нескольким очередям, а затем другие потоки-воркеры, работающие на других процессорных ядрах, забирают пакеты из очередей и обрабатывают.
Количество очередей RSS обычно делается равным количеству процессов, на которые трафик распределяется.
Пример моей настройки прерываний на отдельное ядро на практике (работало)
-
Распределение прерываний в smp_affinity появляется сразу после UP интерфейса, независимо от того, есть ли линк или нет. Если интерфейс не в UP – прерывания распределить не получится.
while true; do echo; echo; grep -w "CPU0\|Rescheduling\|eth8\|eth9" /proc/interrupts | sort -n; sleep 1; done
CPU0 CPU1 CPU2 CPU3
RES: 84049 43750986 110517787 110615940 Rescheduling interrupts
166: 82474083 0 0 0 IR-PCI-MSI-edge eth8-TxRx-0
167: 24042806 0 0 0 IR-PCI-MSI-edge eth8-TxRx-1
168: 59272802 0 0 0 IR-PCI-MSI-edge eth8-TxRx-2
169: 59361007 0 0 0 IR-PCI-MSI-edge eth8-TxRx-3
170: 4 0 0 0 IR-PCI-MSI-edge eth8
180: 82616626 0 0 0 IR-PCI-MSI-edge eth9-TxRx-0
181: 24207180 0 0 0 IR-PCI-MSI-edge eth9-TxRx-1
182: 59306623 0 0 0 IR-PCI-MSI-edge eth9-TxRx-2
183: 59334616 0 0 0 IR-PCI-MSI-edge eth9-TxRx-3
184: 2 0 0 0 IR-PCI-MSI-edge eth9
echo 000002 > /proc/irq/166/smp_affinity
echo 000002 > /proc/irq/167/smp_affinity
echo 000002 > /proc/irq/168/smp_affinity
echo 000002 > /proc/irq/169/smp_affinity
echo 000002 > /proc/irq/170/smp_affinity
echo 000002 > /proc/irq/180/smp_affinity
echo 000002 > /proc/irq/181/smp_affinity
echo 000002 > /proc/irq/182/smp_affinity
echo 000002 > /proc/irq/183/smp_affinity
echo 000002 > /proc/irq/184/smp_affinity
while true; do echo; echo; grep -w "CPU0\|Rescheduling\|eth8\|eth9" /proc/interrupts | sort -n; sleep 1; done
CPU0 CPU1 CPU2 CPU3
RES: 38502 44083017 180343133 172478449 Rescheduling interrupts
166: 83784996 680 0 0 IR-PCI-MSI-edge eth8-TxRx-0
167: 24543343 42381024 0 0 IR-PCI-MSI-edge eth8-TxRx-1
168: 60286755 35225747 0 0 IR-PCI-MSI-edge eth8-TxRx-2
169: 59985599 34032738 0 0 IR-PCI-MSI-edge eth8-TxRx-3
170: 2 0 0 0 IR-PCI-MSI-edge eth8
180: 83957687 682 0 0 IR-PCI-MSI-edge eth9-TxRx-0
181: 24894775 42820948 0 0 IR-PCI-MSI-edge eth9-TxRx-1
182: 60905927 35291571 0 0 IR-PCI-MSI-edge eth9-TxRx-2
183: 59187673 34322303 0 0 IR-PCI-MSI-edge eth9-TxRx-3
184: 4 0 0 0 IR-PCI-MSI-edge eth9
Настройка распределения прерываний на все ядра.
echo 00000f > /proc/irq/65/smp_affinity # eth0-tx-0
echo 00000f > /proc/irq/66/smp_affinity # eth0-tx-1
echo 00000f > /proc/irq/67/smp_affinity # eth0-tx-2
echo 00000f > /proc/irq/68/smp_affinity # eth0-tx-3
echo 00000f > /proc/irq/69/smp_affinity # eth0-rx-0
echo 00000f > /proc/irq/70/smp_affinity # eth0-rx-1
echo 00000f > /proc/irq/71/smp_affinity # eth0-rx-2
echo 00000f > /proc/irq/72/smp_affinity # eth0-rx-3
Посмотреть привязку процесса к CPU
Посмотреть привязку PID к CPUI можно множеством способов. Первый способ с taskset считаю самый простой и надежный, пользовался им при работе с isolcpus, cset shield (выше).
# С помощью самого taskset
~$ taskset -p 6099
pid 6099's current affinity mask: 3

# С помощью ps (столбец PSR)
sh-4.4# ps -eo pid,tid,class,rtprio,ni,pri,psr,pcpu,stat,wchan:14,comm | grep softirq
PID TID CLS RTPRIO NI PRI PSR %CPU STAT WCHAN COMMAND
9 9 TS - 0 19 0 5.7 S - ksoftirqd/0
16 16 TS - 0 19 1 0.0 S - ksoftirqd/1
21 21 TS - 0 19 2 0.0 S - ksoftirqd/2
26 26 TS - 0 19 3 0.0 S - ksoftirqd/3
31 31 TS - 0 19 4 0.0 S - ksoftirqd/4
36 36 TS - 0 19 5 0.0 S - ksoftirqd/5
41 41 TS - 0 19 6 0.0 S - ksoftirqd/6
46 46 TS - 0 19 7 0.0 S - ksoftirqd/7

# С помощью top (столбец P)
> Hit f to get into the Fields Management window
> Select P (Last Used Cpu) ((выбирается backspace))
> Esc
scroll coordinates: y = 1/195 (tasks), x = 1/13 (fields)
PID USER PR NI VIRT RES SHR S %CPU %MEM TIME+ COMMAND P
713 root 20 0 36760 27652 3656 S 0,0 0,3 165:04.34 collectl 1
335 root 20 0 60180 24396 7080 S 0,0 0,3 10:56.09 systemd-journal 0
1 root 20 0 107272 10412 7732 S 0,0 0,1 16:26.84 systemd 0
18601 www-data 20 0 1934252 10156 2472 S 0,0 0,1 0:00.00 apache2 1

# Можно даже сделать простой скрипт, который рассчитает количество процессов на ядро - в примере наиболее загруженны по количеству процессов ядра 0 и 1
root@us:~# ps -eo pid,tid,class,rtprio,ni,pri,psr,pcpu,stat,wchan:14,comm | awk '{print $7}' | sort | uniq -c | sort -n
1 PSR
7 10
7 11
7 3
7 4
7 5
7 7
7 8
7 9
8 2
9 6
55 1
73 0
Taskset
Привязать PID к CPU удобнее всего с помощью taskset. Так же можно использовать cset/cpuset без shield (с shield описано выше).
# Можно напрямую указать конкретный CPU (affinity), range или list (man taskset --cpu-list 0-2,6)
taskset --cpu-list 1 /root/redkin/tcpreplay-master/src/tcpreplay -i enp3s0f1 --topspeed --loop=1000000000000 --duration=600 --preload-pcap /root/redkin/test.pcap &
taskset --cpu-list 2 /root/redkin/tcpreplay-master/src/tcpreplay -i enp3s0f1 --topspeed --loop=1000000000000 --duration=600 --preload-pcap /root/redkin/test.pcap &

# Можно оперировать coremask, но это чаще всего менее удобно
taskset 0xFFFFFFFF /root/redkin/tcpreplay-master/src/tcpreplay -i enp3s0f1 --topspeed --loop=1000000000000 --duration=600 --preload-pcap /root/redkin/test.pcap &

# HEX
~$ taskset -p 0x00000001 6099
pid 6099's current affinity mask: 3
pid 6099's new affinity mask: 1
~$ taskset -p 0x00000002 6099
pid 6099's current affinity mask: 1
pid 6099's new affinity mask: 2

# DECIMAL
 >sudo taskset -pc 7 17551
pid 17551's current affinity list: 7
pid 17551's new affinity list: 7
Могут быть проблемы с привязкой для kernel threads, по идее они решаются только персборкой ядра с отключением флага PF_NO_SETAFFINITY для kernel процессов, но не факт (не изучил до конца этот вопрос – сомнения на основе статьи).
 >ps -p 828
PID TTY TIME CMD
828 ? 00:00:00 nfsiod
>sudo taskset -pc 7 828
pid 828's current affinity list: 0-11
taskset: failed to set pid 828's affinity: Invalid argument

Many kernel threads set the flag PF_NO_SETAFFINITY:
To change the affinity, you would have to change the kernel.
https://stackoverflow.com/questions/25359565/how-one-can-set-affinity-for-kernel-threads
https://stackoverflow.com/questions/60100719/check-value-of-pf-no-setaffinity
Пример привязки на сетевом оборудовании
Прерывание на сетевой карте привязываем к ядру CPU. Из /proc/interrupts можно извлечь распределение прерываний по очередям.
Помещает очередь прерываний первого интерфейса (по умолчанию 60, если в качестве интерфейса захвата eth1) на ЦПУ 0.
cat 1 > /proc/irq/60/smp_affinity

Если задействован второй интерфейс необходимо определить его очередь прерываний. Для этого выполнить команду:
grep <наименование интерфейса> /proc/interrupts
В полученном списке необходимо найти очередь для RX. Для установки свободного процессора необходимо использовать следующую формулу: 2 в степени номер свободного процессора в шеснадцатиричной форме. Например 8 свободный процессор (2^7) = 128. В шестнадцатиричной форме равно 80.
cat 80 > /proc/irq/69/smp_affinity
Number cores: 8
pgrep <proc> | xargs -I PID_PROC taskset -p PID_PROC
pid 23116's current affinity mask: 2
pid 23117's current affinity mask: 4
pid 23118's current affinity mask: 8
pid 23119's current affinity mask: 10
pid 23120's current affinity mask: 20
pid 23121's current affinity mask: 40
pid 23122's current affinity mask: 80
pid 23123's current affinity mask: 100

 /interfaces |tr ',' '
> '| xargs -I ETH grep ETH /proc/interrupts | cut -d: -f1 | xargs -I IRQ_NUMBER head -v /proc/irq/IRQ_NUMBER/smp_affinity
==> /proc/irq/133/smp_affinity <==
0002
==> /proc/irq/134/smp_affinity <==
0004
==> /proc/irq/135/smp_affinity <==
0008
==> /proc/irq/136/smp_affinity <==
0010
==> /proc/irq/137/smp_affinity <==
0020
==> /proc/irq/138/smp_affinity <==
...
CheckPoint рекомендует IRQ между сетевыми картами рекомендует делать такими, чтобы они не пересекались (IRQ swizzling). Рекомендуют отключать Hyper-Threading.
https://downloads.checkpoint.com/fileserver/SOURCE/direct/ID/7555/FILE/Performance_tests_methodology.pdf
Hardware Configuration for Open Server
Interfaces that are constantly used should not share the same IRQ.
To prevent the use of the same IRQ in such a situation perform the following:
1. Upgrade BIOS to enable IRQ swizzling (for platforms that support this option).
IRQ swizzling is designed to enable PCI-E based NICs to have different IRQ pools. For
example, two PCI-E dual cards are put in two separate busses, they will both receive the same
IRQs (16 & 17 for example).
Upgrading the BIOS to include support for IRQ swizzling will enable the second NIC to have
different IRQs (18, 19 for example).
2. Select the ports that do not share the same IRQ for the heavily used network interfaces.
For example, configure the internal/external/sync subnets so that they will not share IRQ
interfaces.
3. Use gigabit based equipment (NICs, switches, cables)
4. Disable hyper-threading
УТИЛИЗАЦИЯ процессора
- idle – наилучший показатель фактической загруженности ядра CPU, потому что если ядро чем то занято, то idle отличен от нулевого, а занято ядро может быть любыми задачами – user/system/idle/iowait/softirq.
- iowait – задача ядра процессора, которая говорит об ожидании ядром диска HDD/SSD (выполнения дисковых операций). Обычно загрузка этой задачей ядром нулевое в сетевой обработке, а когда на практике фиксировал всплески утилизации ядер CPU iowait до 70-100% то это было с влиянием на сетевой трафик (потери). Вероятно на картинке yandex отображено похожее – при всплесках записей на ЖД растет нагрузка на CPU.
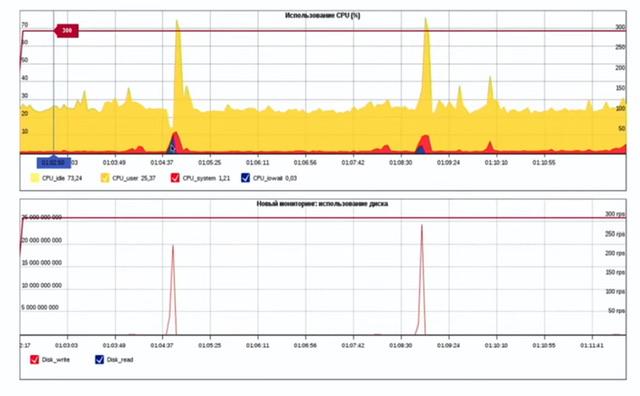
11:36:02 INFO: cpu cores :12
11:36:02 INFO: cpu speed :3655.329MHz
11:36:02 INFO: user :0.07%
11:36:02 INFO: system :1.58%
11:36:02 INFO: idle :85.85%
11:36:02 INFO: iowait :0.04%
11:36:02 INFO: softirq :12.46%
11:36:02 INFO: cycles/byte :5.24
questions
What can be found in the /proc/ directory?
| Оригинал | Перевод |
| One directory per running process. | Один каталог для каждого запущенного процесса. |
| One directory per installed program. | Один каталог для каждой установленной программы. |
| One device file per hardware device. | Один файл устройства на каждое аппаратное устройство. |
| One file per existing user account. | Один файл на каждую существующую учетную запись пользователя. |
| One log file per running service. | Один файл журнала для каждой запущенной службы. |
Очевидно, что «proc» означает процесс. На скриншоте ниже синие цифры — это папки запущенных процессов:

What is a Linux distribution?
| A bundling of the Linux kernel, system utilities and other software. | Набор из ядра Linux, системных утилит и другого программного обеспечения. |
| The Linux file system as seen from the root account after mounting all file systems. | Файловая система Linux, как видно из учетной записи root после монтирования всех файловых систем. |
| The set of rules which governs the distribution of Linux kernel source code. | Набор правил, регулирующих распространение исходного кода ядра Linux. |
| An operating system based on Linux but incompatible to the regular Linux kernel. | Операционная система, основанная на Linux, но несовместимая с обычным ядром Linux. |
| A set of changes to Linux which enable Linux to run on another processor architecture | Набор изменений в Linux, которые позволяют Linux работать на другой |
—-
A bundling of the Linux kernel, system utilities and other software.
Дистрибутив Linux — это операционная система, созданная на основе коллекции программного обеспечения, включающей ядро Linux, систему управления пакетами и другие системные утилиты.
Таким образом, дистрибутив — это не файловая система, не набор правил, не набор изменений Linux.
Which signal is sent by the kill command by default?
A. SIGHUP(1)
B. SIGQUIT(3)
C. SIGKILL(9)
D. SIGTERM(15)
Answer: D
Pressing the Ctrl-C combination on the keyboard while a command is executing in the foreground sends which of the following signal codes?
A. 1(SIGHUP)
B. 2(SIGINT)
C. 3(SIGQUIT)
D. 9(SIGKILL)
E. 15(SIGTERM)
Answer: B
Which file in /proc describes the IRQs that are used by various kernel drivers? (Specify the file name only without any path.)
interrupts
Which of the following kernel parameters instructs the kernel to suppress most boot messages?
A. silent
B. verbose=0
C. nomesg
D. quiet
Answer: D
Which file in the /proc filesystem lists parameters passed from the bootloader to the kernel? (Specify the file name only without any path.)
cmdline ((/proc/cmdline))
Which command is used to start another command with a given nice level? (Specify ONLY the command without any path or parameters.)
nice
What is the default nice level when a process is started using the nice command?
A. -10
B. 10
C. 20
Answer: B
# nice ping 1.1.1.1
# ping 8.8.8.8
# ps ax -o pid,ni,cmd | grep ping
31346 10 ping 1.1.1.1
31408 0 ping 8.8.8.8
Regarding the command: nice -5 /usr/bin/prog Which of the following statements is correct?
A. /usr/bin/prog is executed with a nice level of -5.
B. /usr/bin/prog is executed with a nice level of 5.
C. /usr/bin/prog is executed with a priority of -5.
D. /usr/bin/prog is executed with a priority of 5.
Answer: B
root@spr:~# nice -5 vi &
[1] 12687
root@spr:~# ps -efl | grep vi
0 T root 12687 12666 0 85 5 - 2413 - 22:13 pts/1 00:00:00 vi

root@spr:~# nice --5 nano &
[2] 12700
root@spr:~# ps -efl | grep nano
4 T root 12700 12666 0 75 -5 - 1692 - 22:18 pts/1 00:00:00 nano
Which of the following commands kills the process with the PID 123 but allows the process to “clean up” before exiting?
A. kill -PIPE 123
B. kill -KILL 123
C. kill -STOP 123
D. kill -TERM 123
Answer: D
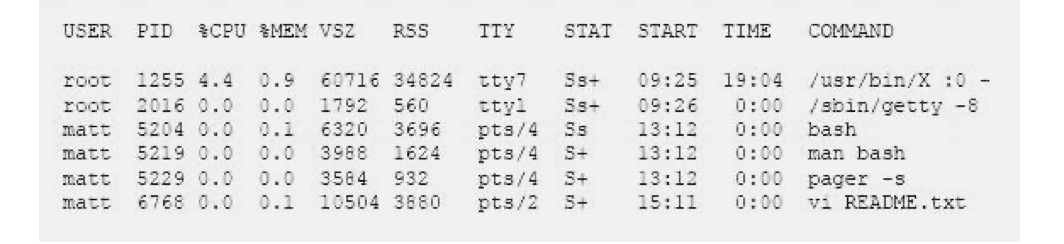
Which of the following commands will produce the following output?
A. jobs
B. proclist
C. netstat
D. ps
Answer: D
Which program runs a command in specific intervals and refreshes the display of the program’s output? (Specify ONLY the command without any path or parameters.)
watch

watch is used to run any designated command at regular intervals.
Open Terminal and type:
watch -n x <your command>
change x to be the time in seconds you want.
What is the maximum niceness value that a regular user can assign to a process with the nice command when executing a new process?
A. 9
B. 19
C. 49
D. 99
Answer: B
What is the process ID number of the init process on a SysV init based system?
A. -1
B. 1
C. It is different with each reboot.
D. It is set to the current run level.
Answer: B
https://www.tecmint.com/linux-process-management/
http://linux-training.be/sysadmin/ch01.html#:~:text=the%20parent%20process.-,init,foster%20parent%20for%20orphaned%20processes.
init
The init process always has process ID 1. The init process is started by the kernel itself so technically it does not have a parent process. init serves as a foster parent for orphaned processes.
What information can be displayed by top?
- Existing files, ordered by their size.
- User accounts, ordered by the number of logins.
- Running processes, ordered by CPU or RAM consumption.
- User groups, ordered by the number of members.
- User accounts, ordered by the number of files.
@ Running processes, ordered by CPU or RAM consumption.