
- (google malt/autorepair, будущее после SNMP, ZTP, Capacity planning) Библиотека полезных статей от research Google:
Ruleset size, ACL size, policy size


выделяемый бюджет заказчика прямо пропорционален количеству правил.
бывает ещё совершенно другая крайность. Иногда по служебкам заводят отдельную политику на каждый порт и на каждое взаимодействие, а не просто добавляют в старое правило новые взаимодействия и порты.  из-за этого политика становиться просто гигантской и неуправляемой

Рефакторить надо не только код, но и политики, я как-то собесился в одну компанию, там сказали, что acl на ФВ около пару млн, на вопрос про рефакторинг, сказали с божьей помощью

В Яндексе вообще 500 млн
но в яндексе и не ngfw с рынка
У них на фряхе
- (Rfc 9411, best practice) Обычно тестируют на 1000 правил, а старшие устройства на 10000 правил. Компании у которых 100 тысяч правил и более часто заказывают собственные тесты.
- Очень базовое (с ошибками т.к. к примеру cc/cps в отчете на профиле emix, а не отдельными тестами) описание проблематики, но хорошие (явно ИИ-based) графики
https://www.securitylab.ru/blog/personal/Bitshield/360444.php
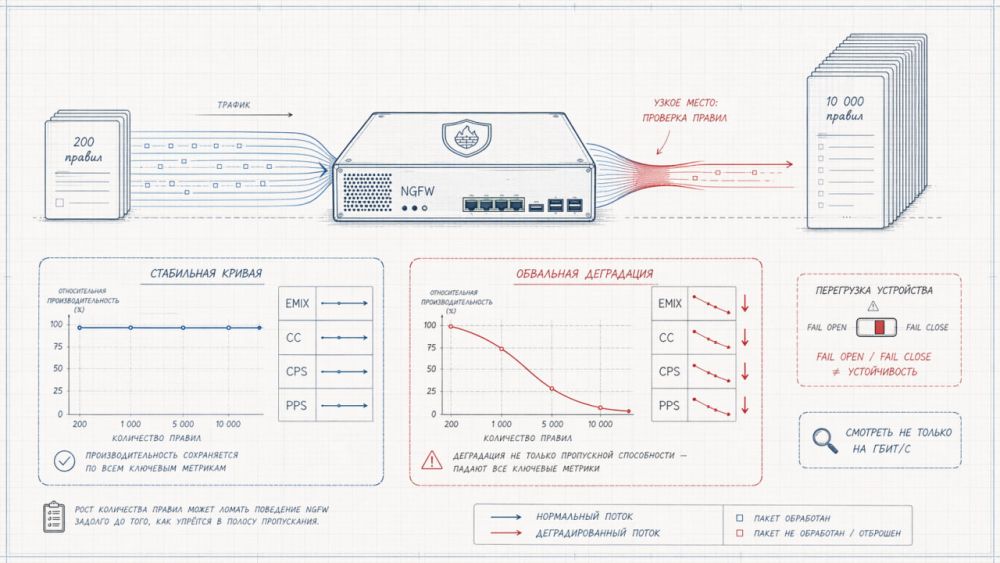
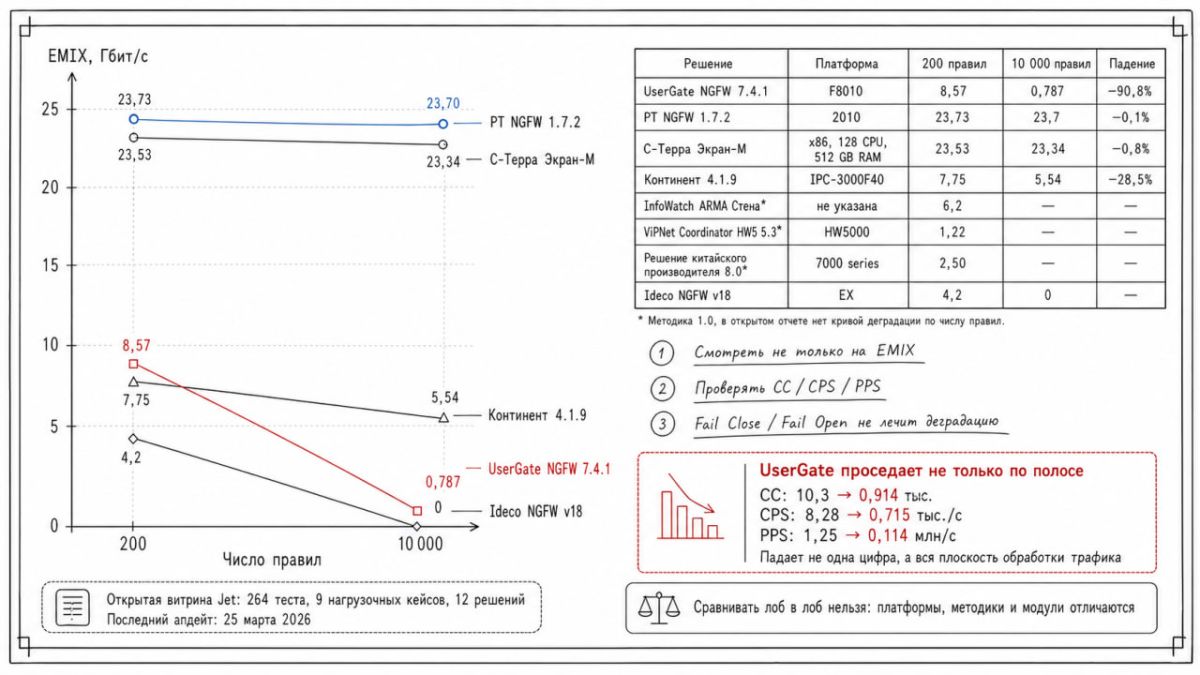
- Базовое сравнение от https://ngfw.jet.su/ по вендорам с деградацией показателей производительности с ростом правил (тоже с ошибками, к примеру заявленный fail close у ряда вендоров)
- У некоторых заказчиков по 10 тыс. и больше правил (25К – реальные пример, пример Батранкова с 80К – он видел максимум, личные примеры общения с оч крупным заказчиком «до десятков тысяч на периметре, до сотни тысяч в ДЦ»); но по факту тут нужен зачастую уже функционал оптимизации правил в продукте, скорей всего большая часть правил ненужная
- Потребность в большом количестве правил есть и будет, поэтому многие вендоры реализовали так или иначе быстрый поиск по множеству правил, зачастую с ростом количества правил производительность или не деградирует или деградирует минимально
- “У PaloAlto нет просадки по количеству правил, там специальная архитектура, (это) в обычных UTM рекомендуют самые частые правила вверх перемещать, выключать контроль приложений/сигнатуры IPS и антивируса” (Батранков)
- Несколько похоже анонсирует и checkpoint – размер влияет, но не так сильно, в сравнении с самими политиками и их размещением (последовательность?). Так же checkpoint не анонсирует предел по правилам.
-
https://community.checkpoint.com/t5/Management/What-is-the-Maximum-number-of-rules-in-R80/td-p/2580 Networking - rulebase performance is affected more with broken acceleration templates based on specific capabilities of some rules (time objects, service with resource, etc.) and less with the size of the policy. While the size does introduce a performance impact, it is negligible comparing to the content of actual rules and their placement in policies.
- Yandex
- YaNet – Yandex NexHop 2021-2022 https://github.com/yanet-platform/yanet?tab=readme-ov-file
- freebsd ipfw – EuroBSDcon 2024
We use FreeBSD as a base OS for our routers, firewalls and VPN gateways in our enterprise network. Ipfw is used to filter traffic between our employees' devices and servers located in our DCs as well as on the Internet. Having more than 65 thousand unique usernames, different filtering policies for wired/wireless/vpn environments, we pack 500 millions of elementary rules (e.g. allow tcp from user@entry_media to myserver 443) into a single router running FreeBSD and ipfw. One single box handles up to 10Gbit/s of traffic.
-
- КодБезопасности – преобразуют правила ip tables в свои префиксные деревья (ТМ) на dpdk. Префиксные деревья используют в проде, но это особый режим «высокороизводительного» экрана (т.е. не ngfw ветка), плюс некоторая деградация производительности с ростом правил все таки есть (дублируется в capacity planning и код безопасности)
- Спец. версия «С-Терра» «Экран-М»
«Экран-М» использует технологию векторной обработки трафика VPP (Vector Packet Processing). Благодаря ей результаты нагрузочного тестирования показали высокую производительность продукта, не зависящую от количества правил межсетевого экранирования или настроек NAT. Однако отметим, что тестирование проводилось на специализированной не серийной платформе с 128 процессорными ядрами и 512 ГБ оперативной памяти. Использование VPP также не требует применения специальных интегральных схем (FPGA или ASIC), а только совместимую сетевую карту, что позволяет использовать продукт на различных аппаратных платформах.
«Экран-М» работает на базе российской операционной системы Astra Linux, что может снимать санкционные риски. В качестве системы обнаружения и предотвращения вторжений (СОВ) используется Open-Source-платформа с глубокой кастомизацией для интеграции в VPP и расширенным логированием. Это позволяет значительно увеличить производительность и применять разнообразные наборы сигнатур от различных производителей, а также создавать собственные.

Среди плюсов «Экран-М» выделяются встроенные модули Web Application Firewall (WAF) и Sandbox, которые не входят в стандартную комплектацию решений других российских производителей NGFW. Хотя тестирование этих модулей выходило за рамки методики, их наличие повышает ценность продукта. Система управления интегрирована в каждое устройство «Экран-М», позволяя управлять локальными настройками и подключаться к другим устройствам в качестве подчиненных.
«Поскольку это первая версия продукта, часть настроек пока выполняется через командную строку (CLI), а веб-интерфейс продолжает развиваться. Также мы отмечаем зависимость модулей друг от друга — например, для работы антивируса необходимо включить WAF, часть URL-фильтрации осуществляется через СОВ. Рекомендуем разработчикам “С-Терра” усовершенствовать систему журналирования, расширить функциональность Statefull в ACL и улучшить систему кластеризации», — говорит Николай Исак, эксперт по сетевой безопасности «Инфосистемы Джет».
-
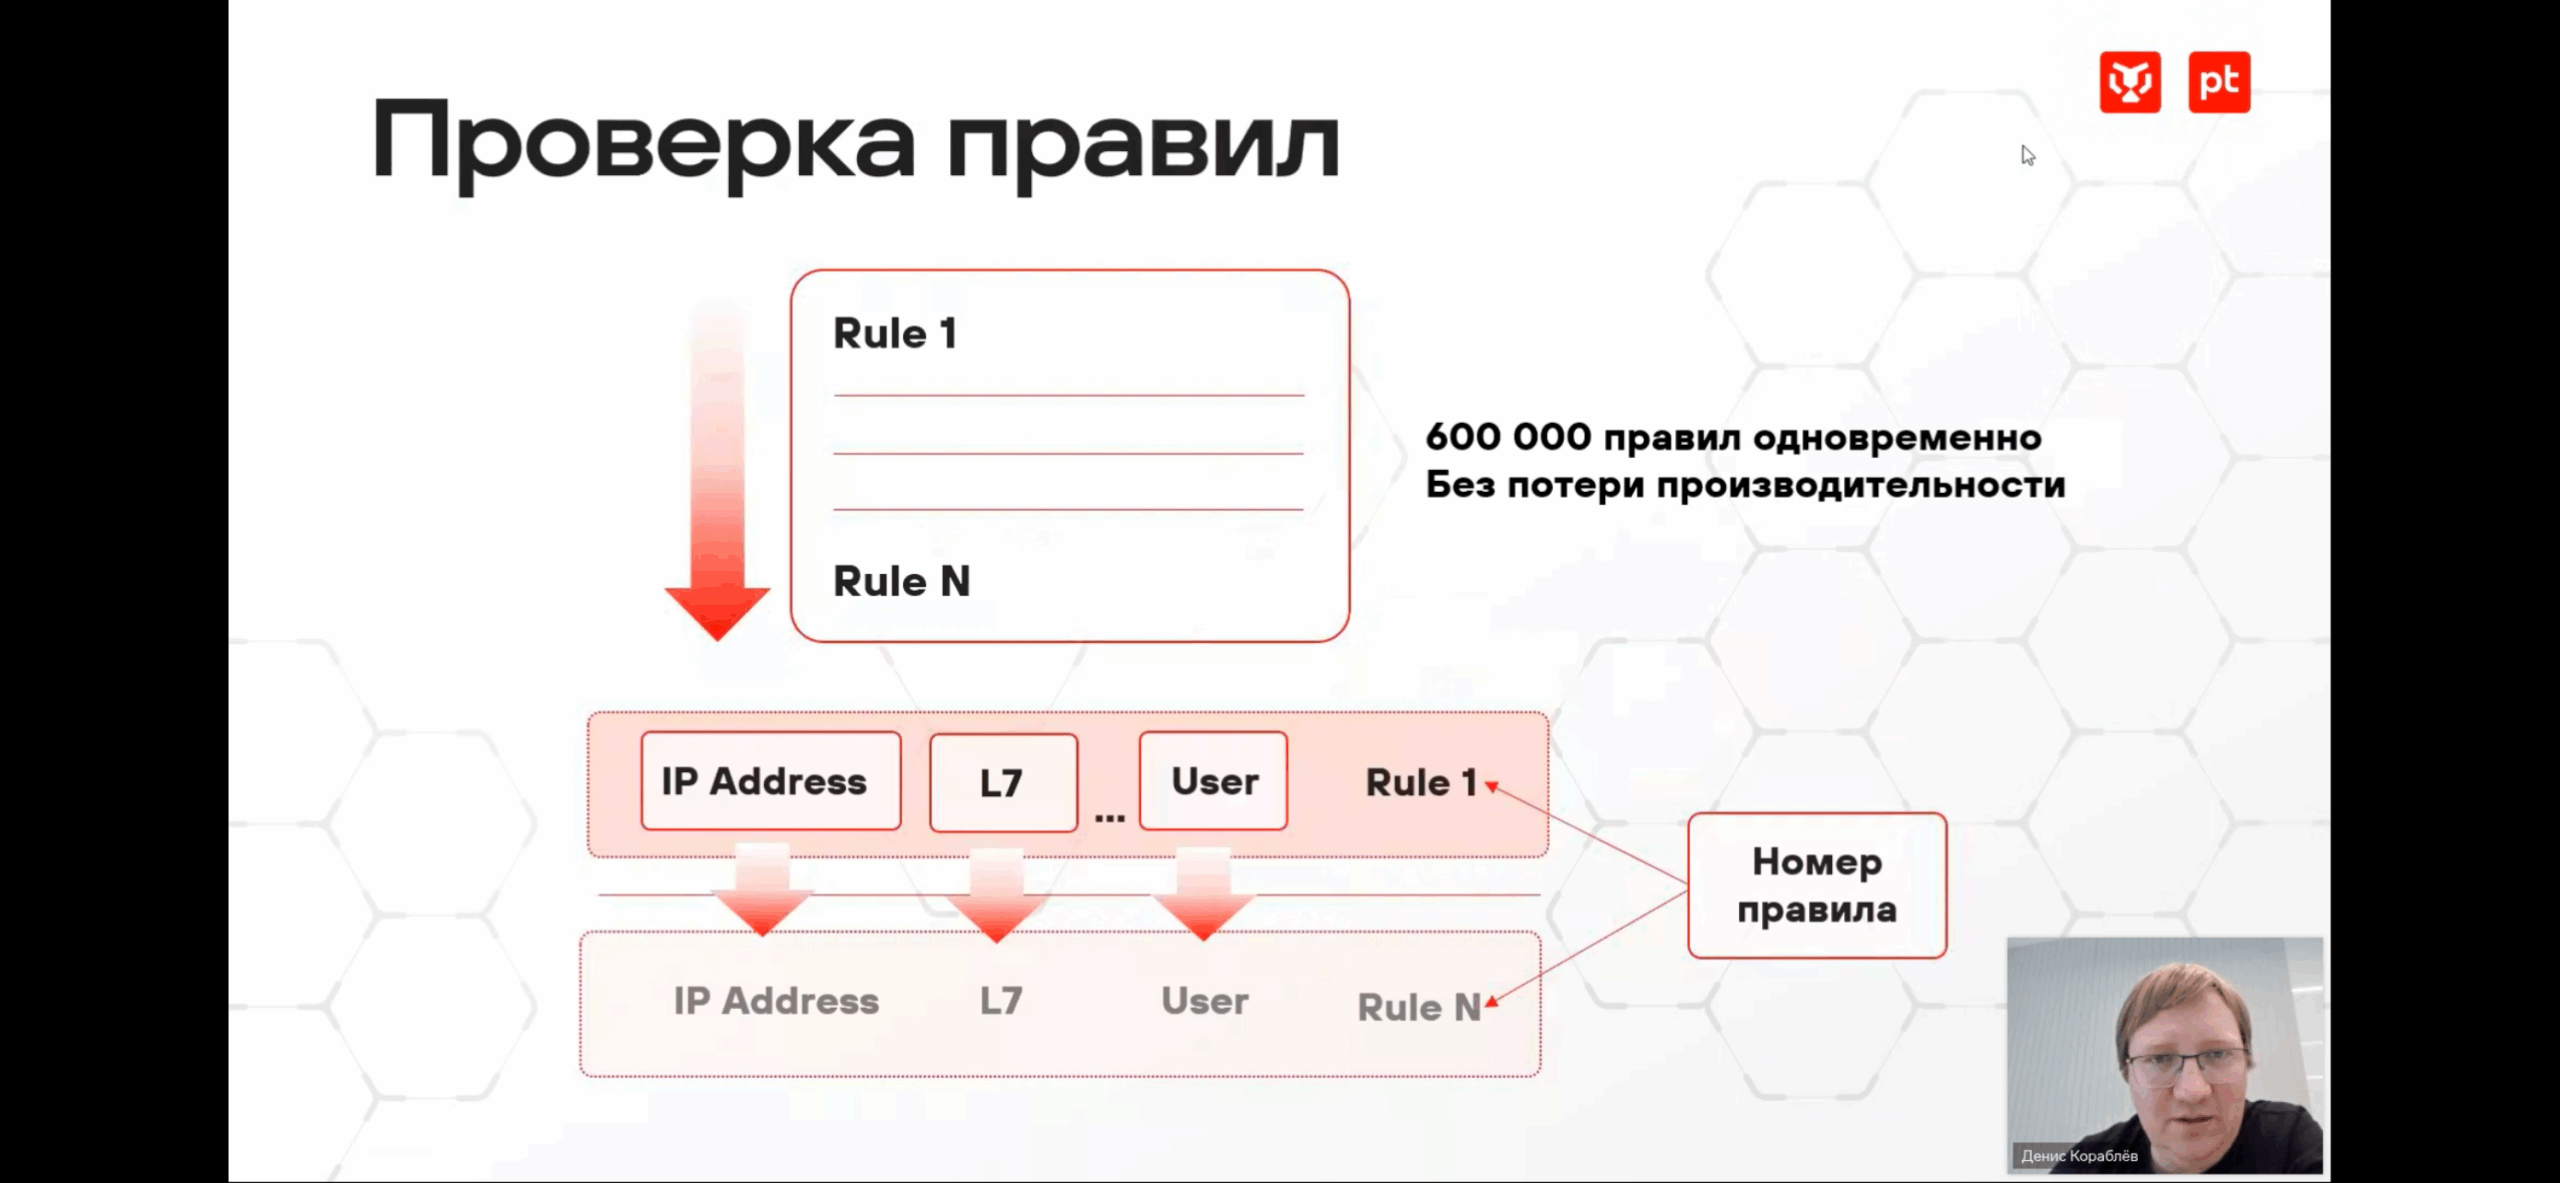
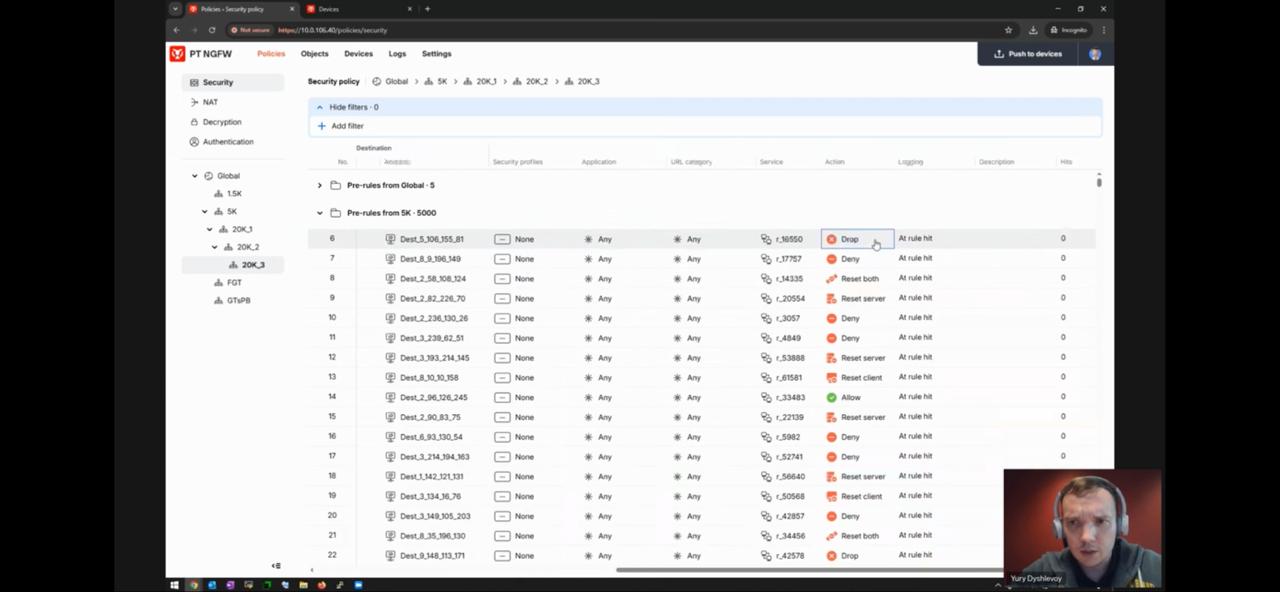
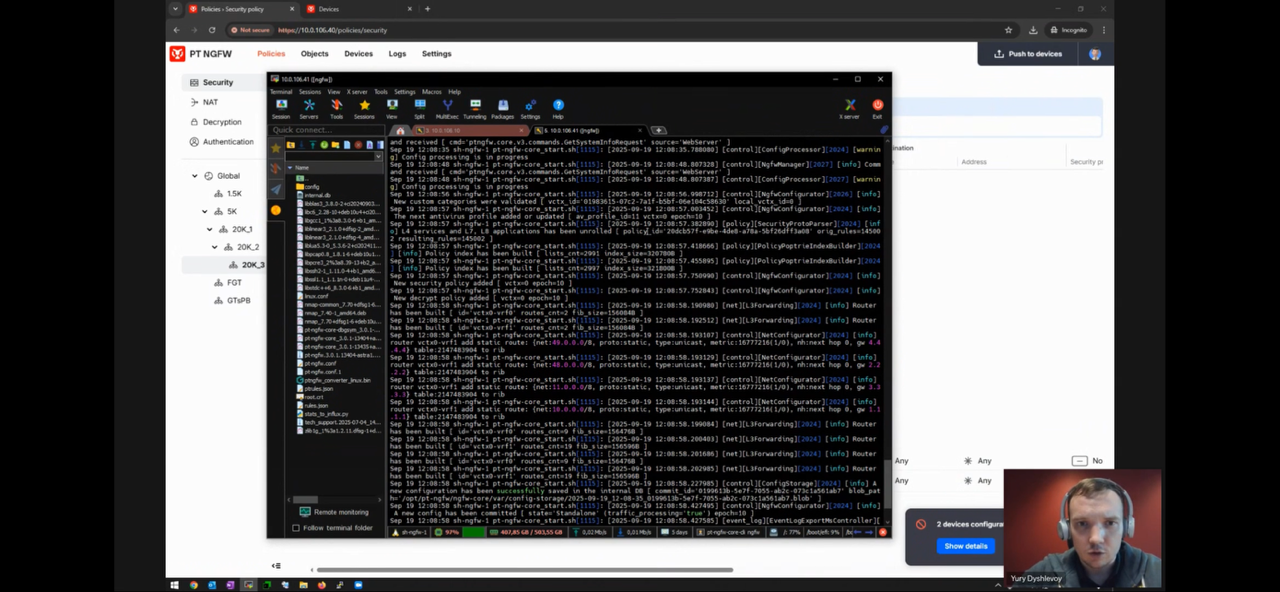
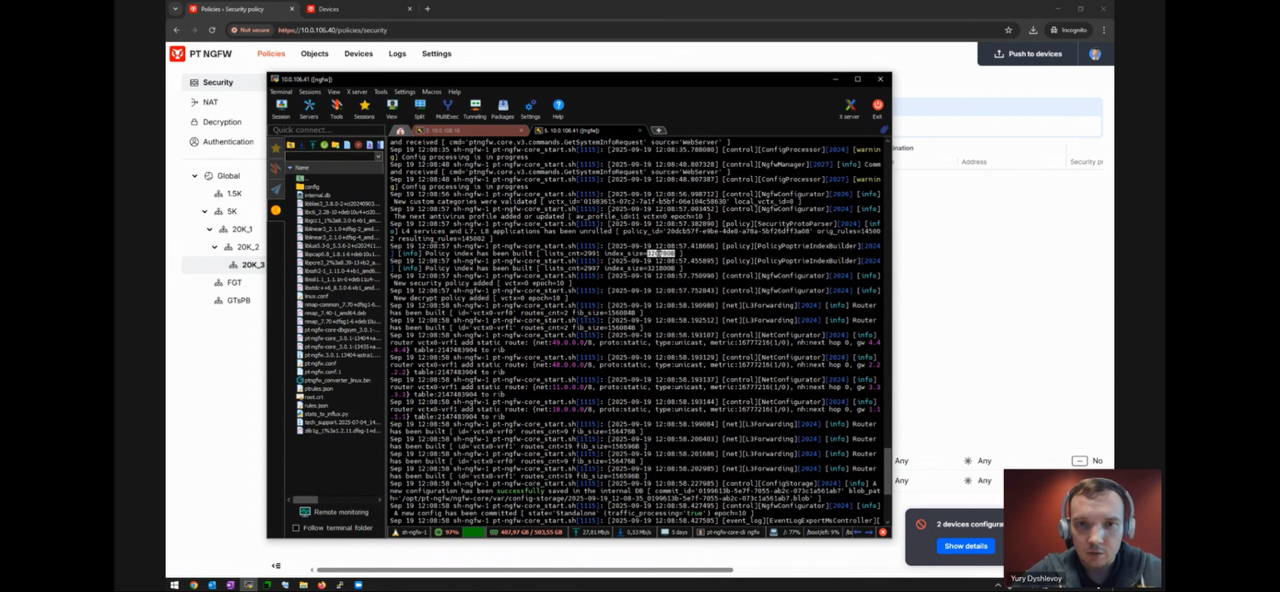
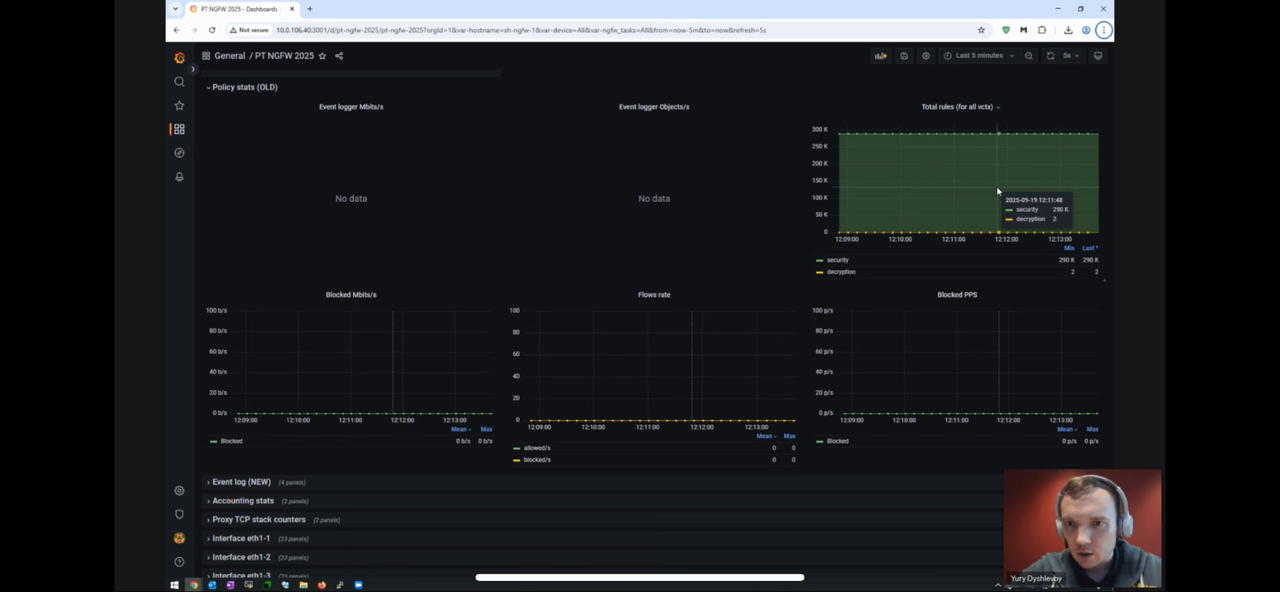
- PT NGFW – 100k или даже 600к правил без значимой деградации производительности – https://pt.comdi.com/event/e19jflfr/broadcast
- (Capacity, pt ngfw) пример правил / занятого под них места (двойное по по количеству numa node) из pt ngfw workshop
- Kaspersky NGFW заявляют 20 тыс правил без значимой деградации производительности – https://youtu.be/6-zpmQWXxv0?si=mlLWJejP8mzSb9lp
- PT NGFW – 100k или даже 600к правил без значимой деградации производительности – https://pt.comdi.com/event/e19jflfr/broadcast
потребление трафика
Throughput (среднее)
(Rfc 9411 якобы best practice) Для кампусных (enterprise) сценариев следует рассчитывать примерно 6 Мбит/с на каждый IP-адрес, а для сценариев тестирования дата-центров — 0.2 Мбит/с на IP.
В ISP: 1000 чел в онлайне вечером требуют канал около 1000мбит = по 1мб на человека.
В Enterprise: NSS labs говорит о 2 mbps – столько обычно закладывается администраторами при проектировании сетей. Градации энтерпрайза нет, но в среднем более 5к крупный, 500-5000 средний, меньше 500 малый (так же меньше 250).
При этом среднее это именно среднее – не повод ограничивать 2 mbps на каждого.
NSS research has shown that, in general, enterprise network administrators architect their networks for up to 2 Mbps of sustained throughput per employee. For example, to support 500 users, an enterprise must deploy 500 agents and/or one network device of 1,000 Mbps capacity.

У нас офис на 100 человек нагрузку на внешний канал в 200-500 Mbps создаёт 😁

так получилось, что начиная с 2022 у нашей компании на поддержке находятся десятки крупнейших компаний РФ и РБ преимущественно на Палоальто..нагрузки в сетях колоссальные  если ограничить пользователе 2мя мбитами, то через 10 минут они придут к вам с вилами.... для врачей, конструкторов и дизайнеров, брокеров и биржи в целом, HD видео/звук, видео конференции,... и тд и тп...
Concurrent Connections
100 CC per user (грубо с запасом). На основе видео канала CISO. Преподносится не как среднее, а как “с запасом даже на пики” (safe bet). Учитывая зачастую “потолочные” значения CC у вендоров NGFW – запас огромный (для 10 ТЫС. пользователей 1 МЛН. сессий).
По моей практике стандартное Linux kernel соединение (python socket) занимает порядка 4КБ и для 1 МЛН. соединений требуется 4GB RAM (аналогично как со стороны клиента, так и со стороны сервера – терминации соединения).
# established
root@debian8:~# netstat -na | grep ESTABLISHED | wc -l
1000002
root@debian8:~# free -h
total used free shared buffers cached
Mem: 15G 4.2G 11G 9.2M 39M 100M

# clear
root@debian8:~# free -h
total used free shared buffers cached
Mem: 15G 317M 15G 9.2M 40M 100M
-/+ buffers/cache: 176M 15G
Swap: 0B 0B 0B
Connections per second
- Обычно важный параметр для банковского сектора – у них много коротких транзакций (UG)
10 CPS (грубо с запасом) per user – лично я думаю ближе к правде автор видео CISO, сложно представить, чтобы для 10 ТЫС. устройств CPS был 10 ТЫС. Скорее он будет 100 тыс.
-
- 5 (3-7) CPS per user/device. На основе видео канала CISO. Преподносится не как среднее, а как “с запасом даже на пики” (safe bet).
- 1 CPS per 10 user/device! На основе видео Батранкова.
OLD (2009)! Bandwith capacity planning ratio access -> ditribution, distribution -> core
The rule-of-thumb recommendation for data oversubscription is
- 20:1 for access ports on the access-to-distribution uplink.
- 4:1 for the distribution-to-core links.

When you use these oversubscription ratios, congestion may occur infrequently on the uplinks. QoS is needed for these occasions. If congestion is frequently occurring, the design does not have sufficient uplink bandwidth
CAPACITY PLANNING/MONITORING
- (Monitoring) 50-80% Beeline, нагрузка на каналы
- Alert 80% – плановое расширение (звезда), 50% – кольцо
- Emergency 90% – аварийной расширение
- (Capacity planning) 80% Microsoft, общая нагрузка на систему – предельная нагрузка на систему в рамках capacity planning, которая позволяет еще справляться с некоторыми burst и аномальным поведением.
https://docs.microsoft.com/en-us/windows-server/administration/performance-tuning/role/active-directory-server/capacity-planning-for-active-directory-domain-services

As all capacity planning is done for peak usage periods, redundant components should not be factored into the available resources and planned peak utilization should not exceed 80% saturation of the system (in order to accommodate bursts or anomalous system behavior).

As mentioned previously, when planning capacity for an entire site, the goal is to target a design with an N + 1 capacity design, such that failure of one system during the peak period will allow for continuation of service at a reasonable level of quality. That means that in an “N” scenario, load across all the boxes should be less than 100% (better yet, less than 80%) during the peak periods.
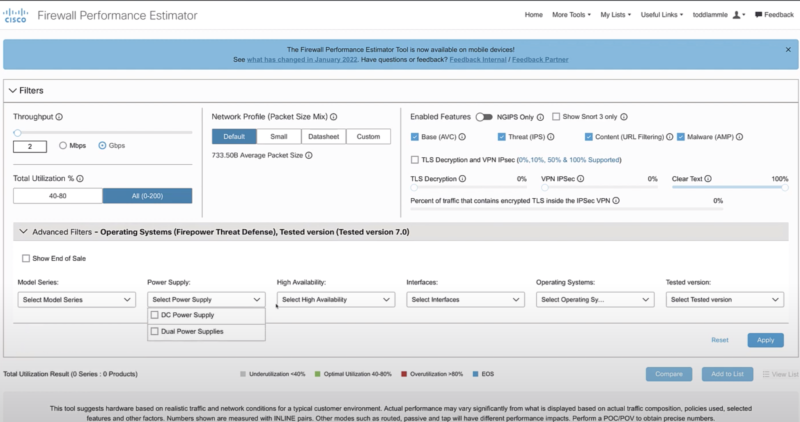
- (Capacity planning) Разные подходы, на основе возможностей выборки в NGFW Performance Estimator Cisco Firepower. В данной утилите Cisco явно подписывает средние ожидания (внизу сайта):
- <40 underutilization
- 40-80 optimal utilization
- >80 overutilization
- (Capacity planning) 50-80% Cisco, нагрузка на каналы – пишут при планировании Core сети от нагрузки в 50-60%, но при просмотре на реальную Core сеть с высокой девиацией и избыточностью в топологии, а не тестовый стенд. Кроме того так же написано про “Many IT organizations order new circuits (which can take anywhere from 30 to 90 days to deploy) when a circuit operates at 60 to 80 percent of capacity“. Т.е. подразумевается, что есть какой-то запас от 60-80 процентов, который позволит “продержаться” до аварии еще 30-90 дней.
https://www.cisco.com/c/en/us/products/collateral/routers/wan-automation-engine/white_paper_c11-728551.html
The simplest core capacity planning processes use passive measurements of core link utilization statistics and apply rules of thumb, such as upgrading links when they reach 50 percent average utilization, or some other general utilization target.

https://www.cisco.com/c/dam/en_us/about/ciscoitatwork/downloads/ciscoitatwork/pdf/Cisco_IT_Case_Study_Capacity_Planning.pdf
A WAN circuit running at 80 percent of capacity is too full. Even a circuit that averages 60 percent of capacity may well peak at 95 percent of capacity for several periods during a day, reducing user productivity and negatively affecting business activities. Many IT organizations order new circuits (which can take anywhere from 30 to 90 days to deploy) when a circuit operates at 60 to 80 percent of capacity.
- (Monitoring) Разная нагрузка по памяти и CPU может являться нормой, поэтому лучше всего понять, какая нагрузка нормальна и отклонения от нее рассматривать. Я считаю это логичный, но спорный подход – напр. один тип оборудования в разных сегментах может иметь разные нормы, делать специфику для каждого при больших объемах устройств сложно и глупо – в том числе возможны ошибки (забыли убрать/поставить на специфичный мониторинг и проч), да и стоит ли формировать вообще аларм мониторинга, если оборудование не достигает известных граничных показателей и потребление CPU/памяти планомерно не растет.
https://www.ciscolive.com/c/dam/r/ciscolive/us/docs/2018/pdf/BRKARC-3146.pdf
CPU
At what percentage level should I start troubleshooting ? It depends on the nature and level of the traffic. It is very essential to find a baseline CPU usage during normal working conditions, and start troubleshooting when it goes above a specific threshold. E.g., Baseline CPU usage 25%. Start troubleshooting when the CPU usage is consistently at 50% or above.

Memory
At what percentage level should I start troubleshooting ? It depends on the nature and level of feature config on the switch. It is very essential to find a baseline memory usage during normal working conditions, and start troubleshooting when it goes above specific threshold. E.g., Baseline memory usage 40%. Start troubleshooting when the memory goes above 70% and constantly keeps increasing without adding any new configuration.
- Множество примеров распространнености (Cisco, Juniper, Huawei, Solarwinds, Hitachi, IBM) использования 80% порога как верхней границы при capacity planning и как нижней границы мониторинга (Informational/Alert) как при мониторинге каналов, так и устройств (память ОП/HDD, CPU)
https://stackoverflow.com/questions/2302054/optimal-cpu-utilization-thresholds
Yep, I'd suggest 100% is thrashing so wouldn't want to see processes running like that all the time.
I've always aimed for 80% to get a balance between utilization and room for spikes / ad-hoc processes.

htps://www.cisco.com/c/en/us/td/docs/voice_ip_comm/cust_contact/contact_center/icm_enterprise/icm_enterprise_10_5_1/Configuration/Guide/UCCE_BK_S8839AA8_00_serviceability-best-practices-guide/UCCE_BK_S8839AA8_00_serviceability-best-practices-guide_chapter_01000.html
Threshold: 80% (of physical memory)

https://www.juniper.net/assets/uk/en/local/pdf/solutionbriefs/3510631-en.pdf
If the data for a given KPI exceeds the thresholds specified
by the network operator—in this example, 50% and 80%
utilization—HealthBot will trigger an alert. Depending on which
threshold is exceeded, the alert will either be yellow or red in
the dashboard. These triggers can also drive alerts through
other notification channels, like e-mail, as well as other systems.

https://www.cisco.com/c/en/us/td/docs/switches/datacenter/nexus9000/sw/92x/icam/b-cisco-nexus-9000-series-nx-os-icam-configuration-guide-92x/b-cisco-nexus-9000-series-nx-os-icam-configuration-guide-92x_chapter_010.html
Info Threshold = 80 percent (default) |
Warning Threshold = 90 percent (default) |
Critical Threshold = 100 percent (default)

https://www.juniper.net/documentation/us/en/software/junos/network-mgmt/topics/ref/statement/rising-threshold-edit-snmp-health-monitor-qfx-series.html
rising-threshold (Health Monitor)
Default: 80 percent of the maximum possible value

https://support.huawei.com/enterprise/en/doc/EDOC1000178172/6c42dd2e/configuring-the-log-and-alarm-threshold-for-inbound-and-outbound-bandwidth-usage
The default log threshold for inbound and outbound bandwidth usage on an interface is 80%.
At 5T, the interface bandwidth usage reaches 75%. The system generates a log to ask you whether to expand the device capacity.
If you do not expand the device capacity, the interface bandwidth usage reaches 80% at 6T. The system generates an alarm, indicating that the bandwidth is almost exhausted and reminding you to take proper operations.

https://support.huawei.com/enterprise/ru/doc/EDOC1100058923/bfc52bc9/configuring-the-thresholds-of-cpu-usage-and-memory-usage
By default, the overload threshold value of CPU usage is 95, and the alarm recovery threshold of CPU usage is 75.
By default, the overload threshold value of memory usage is 95, and the alarm recovery threshold of memory usage is 75.

https://www.cisco.com/c/en/us/td/docs/ios-xml/ios/bsm/configuration/15-2mt/bsm-cpu-thresh-notif.html
The following example shows how to set a rising CPU thresholding notification for total CPU utilization. When total CPU utilization exceeds 80 percent for a period of 5 seconds or longer, a rising threshold notification is sent.
Router(config)# process cpu threshold type total rising 80 interval 5
Setting a Falling CPU Thresholding Notification Example
The following example shows how to set a falling CPU thresholding notification for total CPU utilization. When total CPU utilization, which at one point had risen above 80 percent and triggered a rising threshold notification, falls below 70 percent for a period of 5 seconds or longer, a falling threshold notification is sent.

https://documentation.solarwinds.com/en/success_center/nta/content/nta-finding-the-cause-of-high-bandwidth-utilization-sw1419.htm
For example, you may have set the trigger threshold at 80% of interface bandwidth and you now see an alert-related event.

IBM System Storage SAN Volume Controller and Storwize V7000
Procure more bandwidth if the utilization rises above approximately 80 percent of your configured bandwidth guarantees at any time.

https://knowledge.hitachivantara.com/Documents/Storage/NAS_Platform/13.6/NAS_Administration_Guides/File_Services_Administration_Guide/20_Controlling_file_system_space_usage
The file system should be maintained at a usage level no higher than 80%.

https://www.datacenterknowledge.com/archives/2013/03/06/improving-capacity-planning-using-application-performance-management
First, when a problem does occur, APM will alert IT operations of the incident. For example, let’s say a server has exceeded 80 percent utilization.
In this scenario, IT knows it needs to take action and can dig down into the server workload data.
Capacity management can then be used to run what-if scenarios for the affected server and entire application delivery chain, providing a plan that addresses the machine causing the alert in APM. The fix could be something as simple as upgrading the underlying hypervisor to a new version, which will change the workload characteristics and bring the server’s performance back into line.

https://visualstorageintelligence.com/balancing-performance-and-capacity-in-your-future-storage-plans/
In a typical capacity plan, an organization might set their percent of available capacity threshold to 80 percent.